OVERVIEW
The U.S. stock market rebounded strongly last week as volatility, as measured by the VIX index, fell below 20. The S&P 500 stock index rose 3.83%, the Nasdaq gained 3.61%, and the Dow surged 4.02%. Growth shares led the way, gaining about 4.3%, while value shares gained about 2.85%.
International stocks did well, too. The MSCI EAFE index of developed country stocks rose 2.44%, and the MSCI EM index of emerging market stocks increased 1.13%.
The bond market brushed off the inflation report on Friday, and the 10-year U.S. Treasury note yield settled around 1.486%, but that was still up from the prior week. As a result, long-term Treasuries were down roughly 3.8%, investment-grade bonds fell 0.95%, municipals declined 0.03%, and TIPS dropped 0.88%. High-yield (junk) bonds, however, rose 0.65%.
Real estate had a strong week, gaining 2.77%. Commodities were up about 1.15% overall. Oil gained 8.4%, gold rose slightly by 0.05%, and corn gained 1.03%. The U.S. dollar fell 0.08%.
KEY CONSIDERATIONS
Seeing the Present Clearly – One way to think about an investor’s job is that it’s not about seeing the future but rather about seeing the present clearly. So, with that in mind, let’s run through how we see the investing environment today through the lens of our key stock market risk categories.
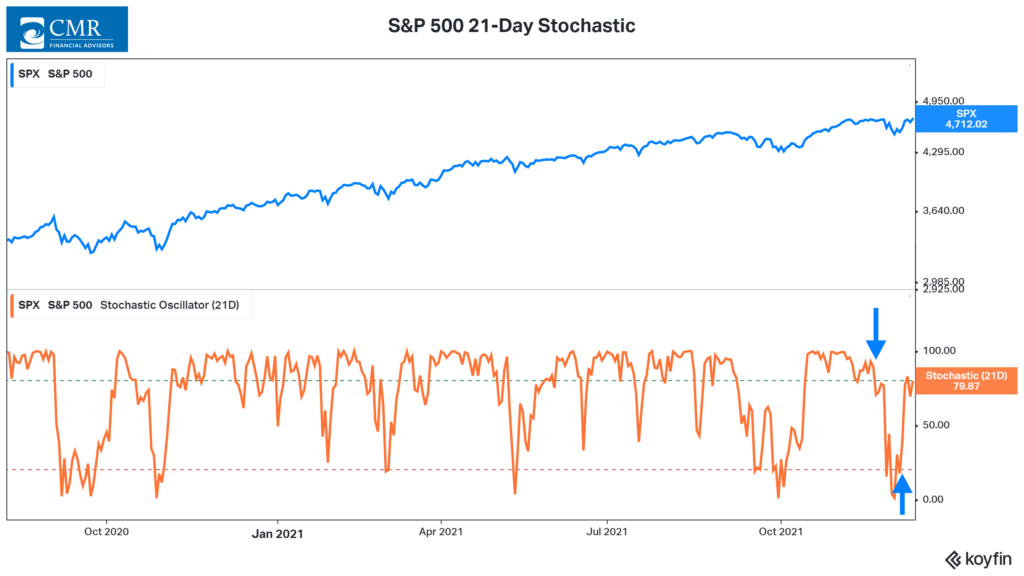
First up, Price Movements. This category focuses on the price movements of financial assets themselves, ignoring external factors. It has deteriorated over the past month as the S&P 500 stock index saw a peak-to-trough decline of roughly 4% that lasted about two weeks. However, stocks turned the corner this past week and rebounded strongly. As a result, the Price Movement component has held up and remains bullish.
For example, the technical indicator below—a 21-day stochastic—shows how stock price momentum slowed down in November, warning of a potential selloff. However, by the beginning of December, it appeared the selloff had run its course, and the indicator gave the all-clear sign with a buy signal.
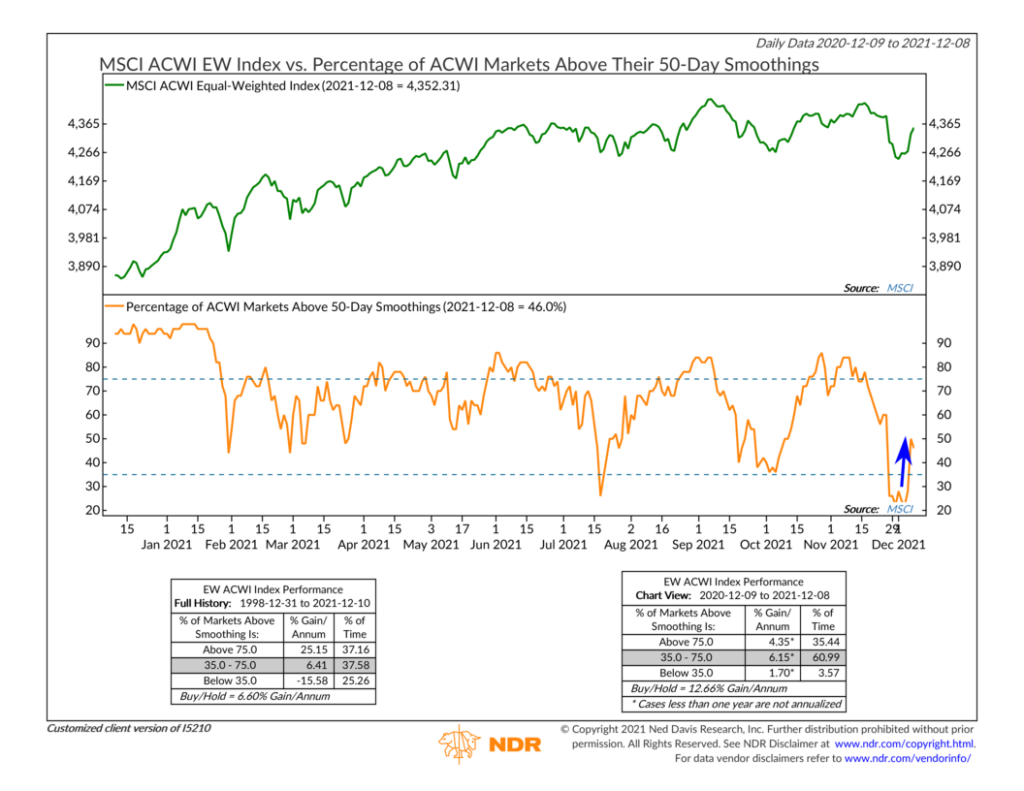
Globally, the message was similar. The chart below shows that the percentage of stock markets worldwide that were trading above their average 50-day price fell to a low of just 22% by the end of November. But by last week, it had rebounded to nearly 50%. Global breadth didn’t stay bearish for long. And overall, our Price Movements category remains bullish.
Next up, we have Sentiment. About a month ago, this component didn’t look too well, as valuations were high and investor optimism had reached pretty high levels. It appeared stocks were ready for a pullback. And we did get a pullback—a small one, that is—but sentiment quickly sank as investors said they were suddenly more pessimistic about the future. That set the tone for last week’s rally.
This week’s Indicator Insights goes through how the Surveys/Polls component of the model anticipated that change in price action via sentiment, and I’d encourage you to check it out if you want more of an explanation. But the key takeaway is that enough optimism was flushed out of the system—and it was done quickly enough—that it provided a setup for the rally we experienced last week. The current state of the Sentiment component, therefore, is primarily neutral right now.
And lastly, we have Economic Activity. This is also in a neutral zone, but unlike the Sentiment component, it has been deteriorating since October. A few things explain this.
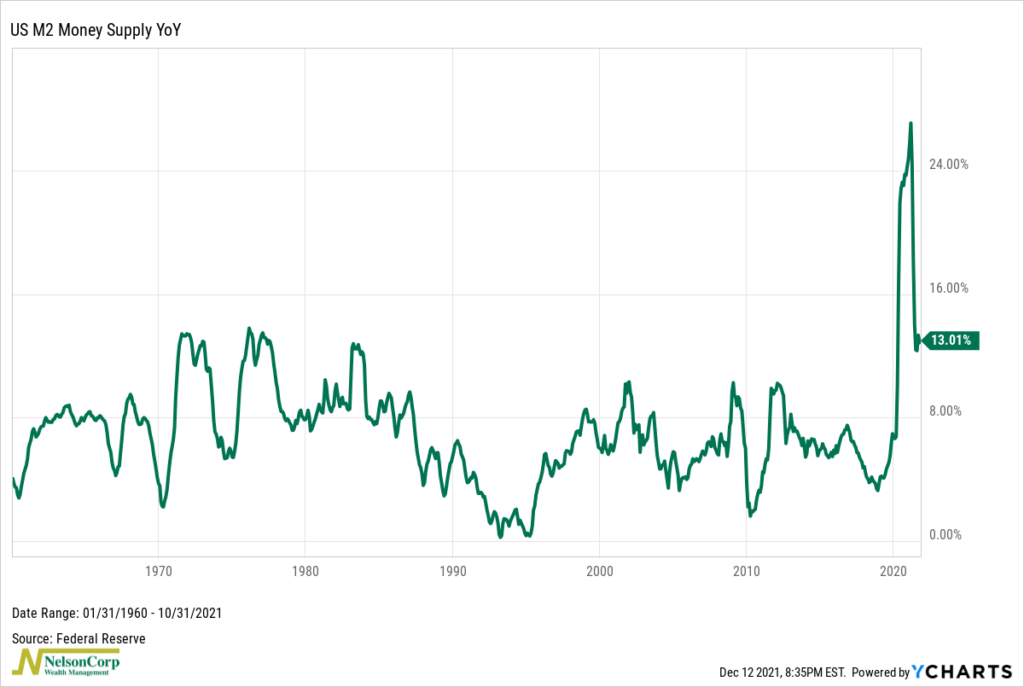
For one, while not necessarily drying up, liquidity has been coming back to more neutral levels of late. The year-to-year change in the M2 measure of the money supply, shown on the chart below, has come down from its peak in March and now stands around 13%. While that’s still above the long-term average growth rate, the trend does appear to be moving down.
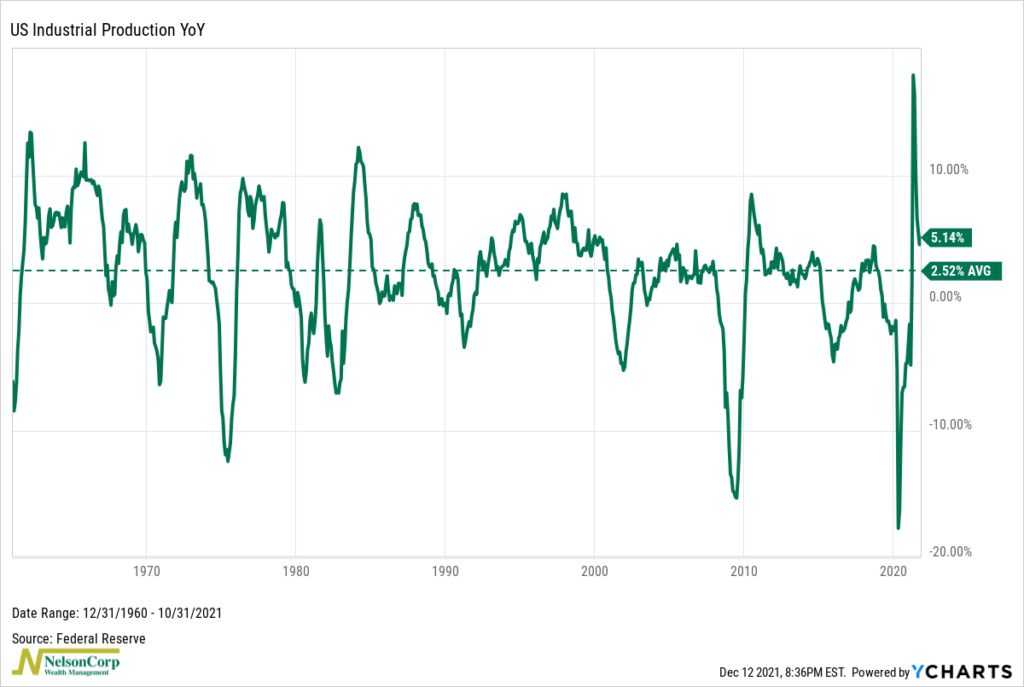
The other area that’s been deteriorating involves indicators that track real economic output. The year-to-year change in industrial production, for example, has also fallen from its peak earlier this year and is now closer to its long-term historical average. Again, this isn’t a negative sign for the economy but rather an indication that things are getting back to more normal (neutral) levels.
So that’s a brief overview of how we see things presently. The overall outlook remains mostly bullish, but with a few areas that aren’t as bullish as earlier this year.
This is intended for informational purposes only and should not be used as the primary basis for an investment decision. Consult an advisor for your personal situation.
Indices mentioned are unmanaged, do not incur fees, and cannot be invested into directly.
Past performance does not guarantee future results.
The post Seeing the Present Clearly first appeared on NelsonCorp.com.