OVERVIEW
The S&P 500 index reentered bear market territory last week with a 4.65% weekly decline. The Nasdaq Composite, down more than 30% this year, fell 5.07%, and the Dow Jones Industrial Average dropped 4%.
Foreign stocks had a rough week as well. Developed country stocks saw price declines of 5.62%, and emerging market stocks dropped around 4.05%.
Bonds didn’t provide much safety as yields continued to march higher. The 10-year Treasury yield rose to 3.7%, up from 3.5% the previous week. Longer-duration Treasuries, corporate bonds, municipal bonds, and TIPS were all down more than 1% for the week.
Real estate got hammered, plummeting around 7.6% for the week. Commodities overall were down about 3.7%. Oil fell 6.55%, gold dropped 1.66%, and corn edged lower by about 0.07%. And finally, in sharp contrast to every other asset, the U.S. dollar appreciated over 3% to end the week.
KEY CONSIDERATIONS
Revisiting the Low – On June 16th, the S&P 500 stock index hit a low of roughly 23.5% below its all-time high. More than 20% off the high is the conventional definition of a bear market.
But then, the market embarked on a roughly 17% rally. Some investors thought at the time that June might have been the low. Perhaps the Fed would pivot and get less hawkish, they thought.
But it was a head fake, a bear-market rally, if you will. There would be no Fed pivot. By mid-August, the rally was over. And now, the market is revisiting its mid-June low.
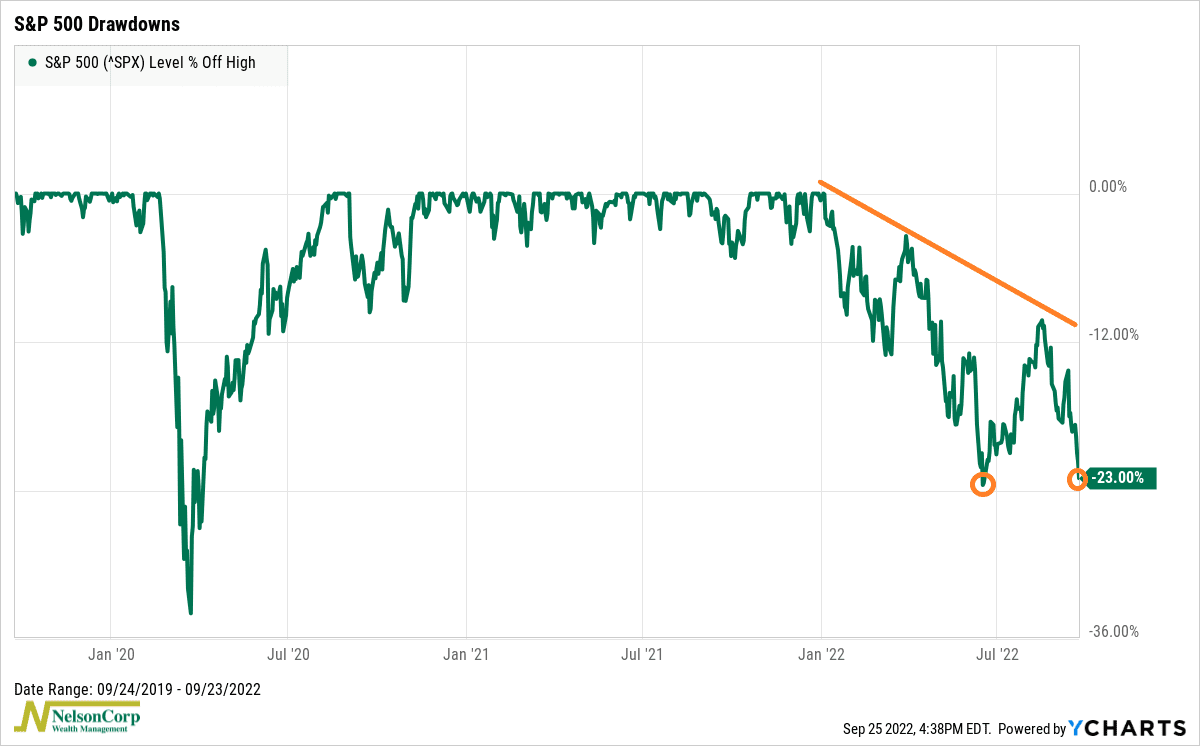
The chart above measures the percentage drawdown of the S&P 500 index. After last week’s selling, it’s 23% off its all-time high.
What stands out about this chart is how different it looks compared to the brief bear market we experienced in 2020, which you can see on the far left of the graph. Back then, the market collapsed quickly in the face of the global pandemic. But the selling was over before you could blink. The market bottomed after just a month. And six months later, we were back to all-time highs.
Compare that to this cycle. It’s been almost ten months since the stock market last saw its high, and we’re still heading lower. You can literally draw a line on the chart and see that the overwhelming trend is to the downside. This is what a bear market feels like.
In our Indicator Insights blog post this week, we pointed out that the probability that the U.S. economy could enter a recession in the next 12 months is growing. According to the spread between the 3-month Treasury yield and the 10-year Treasury yield, the chance of a recession is roughly 25% currently. The idea that corporate earnings could be taking a hit as the economy slows has got investors on edge, and stocks are selling off aggressively.
And then there’s monetary policy and the Fed. In our Chart of the Week post, we showed a couple of charts that illustrated how there is a lot of uncertainty permeating out of the Federal Reserve as it tries to control the smoldering-hot inflation we’ve been suffering through this year. At each meeting this year, the Fed has continually raised its estimate for where it expects the fed funds rate to top out at (the terminal rate), and it keeps lowering its expectations for economic growth. This type of uncertainty is a recipe for a volatile stock market.
Slowing economic growth, restrictive monetary policy, soaring inflation, etc. All these things get measured and accounted for in our Economic Data model, which is one of the three main pillars of our primary stock market risk model.
As you can see on the chart below, this model has been either neutral or negative all year. And it’s currently hovering around the negative levels last seen during the bear market of 2008.
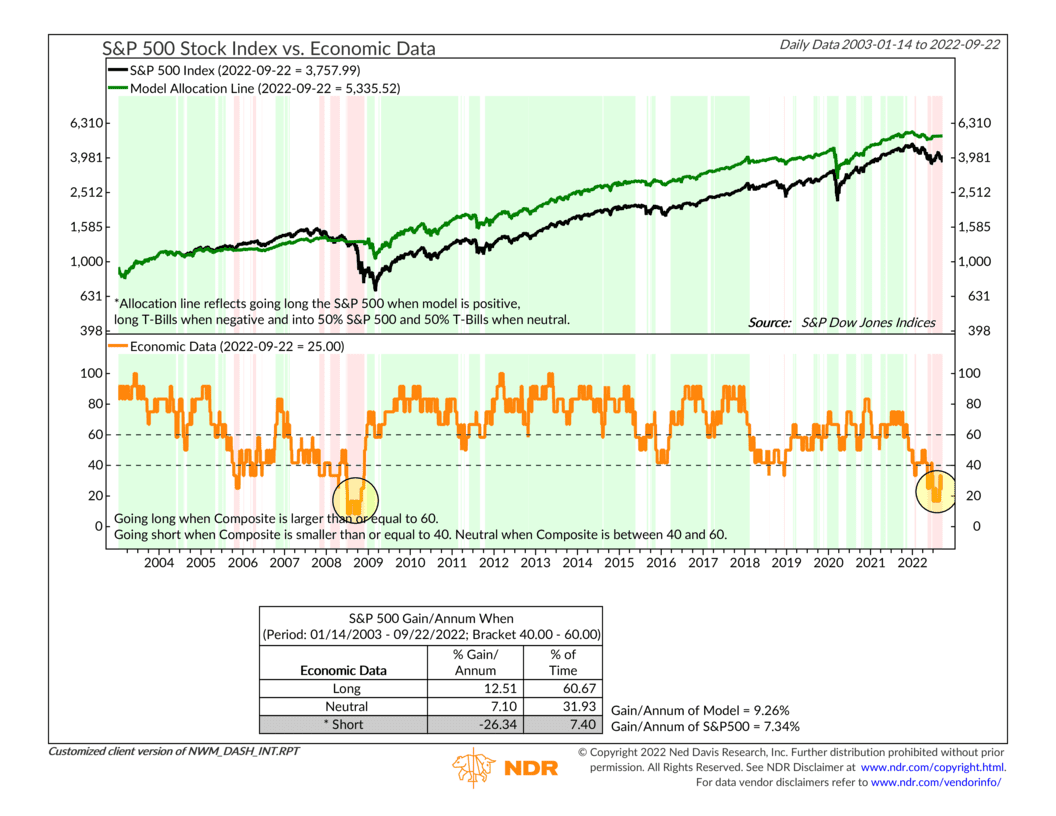
So, the main takeaway from all this? The economic and monetary policy backdrop is clearly negative. And the price trend of the market is also distinctly to the downside. Eventually, this will all turn around. But until then, historically, it has paid to respect when the market is in a downtrend, which is even more relevant when the underlying economic environment is negative.
This is intended for informational purposes only and should not be used as the primary basis for an investment decision. Consult an advisor for your personal situation.
Indices mentioned are unmanaged, do not incur fees, and cannot be invested into directly.
Past performance does not guarantee future results.
The post Revisiting the Low first appeared on NelsonCorp.com.