OVERVIEW
The U.S. stock market snapped a two-week winning streak last week as the S&P 500 shed 1.7% on the week. The Dow Jones Industrial Average dropped 2.15%, and the Nasdaq Composite fell 1.6%, also snapping a two-week run of gains.
The declines in value stocks, which fell 2.08% on the week, were slightly larger than the declines for growth stocks, which dropped about 1.6%. Small caps took the biggest beating, however, dropping over 3% for the week.
Relatively speaking, foreign stocks fared better than their domestic counterparts. Developed country foreign stocks fell 0.34%, and emerging market stocks declined 0.53%.
As for bonds, they held up decently well. Long-term Treasuries gained about 0.17% for the week. Both investment-grade and high-yield corporate bonds rose 0.11%. And TIPS gained 0.4% while municipal bonds fell just three basis points.
Over in the real asset space, real estate got crushed with a 4% weekly decline. Commodities, however, held up better, remaining roughly flat on the week. Oil saw gains of about 0.3%, but gold declined around 2.3%. And finally, the U.S. dollar strengthened by about 0.57%.
KEY CONSIDERATIONS
Quiet Periods – The stock market found itself stuck on a one-way street last week. The S&P 500 Index declined on all four trading days of the holiday-shortened week.
With that said, however, the declines were relatively mild. As of last Friday’s close, stocks were just 1.73% off their all-time highs.
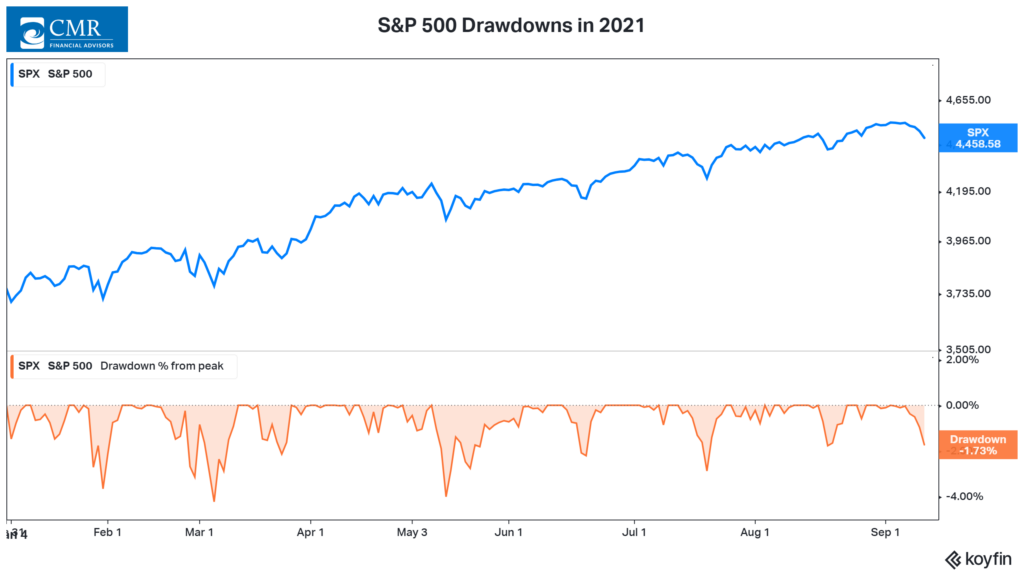
In fact, it’s been relatively quiet for the S&P 500 index all year. As you can see from the chart above, the index hasn’t had a decline of 5% or more this year.
In this regard, it feels a lot like 2017—which, like this year, was the first year of a brand-new presidency.
Here’s what the drawdown chart looked like in 2017.
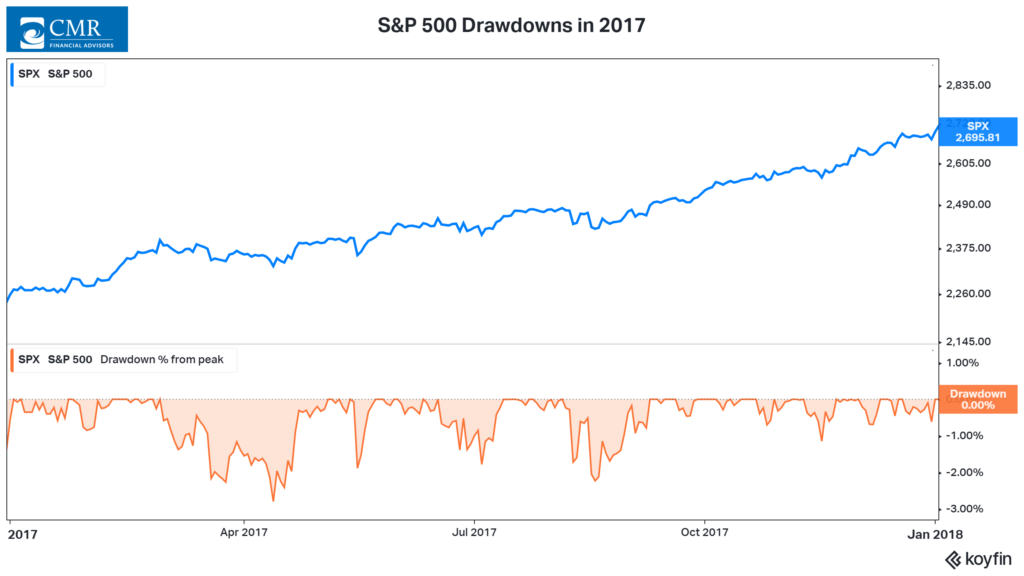
Stocks never dropped more than 3% from their highs all that year.
But then 2018 rolled around, and the S&P 500 had two corrections (declines of 10% or more) that year. History suggests that complacency can lead to selloffs, so there is a concern that a correction is due for stocks sometime soon.
But there are some differences to point out between these two periods as well. Below is a chart of the CBOE Volatility Index, also known as the “fear index.” If you look at 2017, you can see it reflected widespread complacency as it traded in a historically low range of 9 to 16 all year.
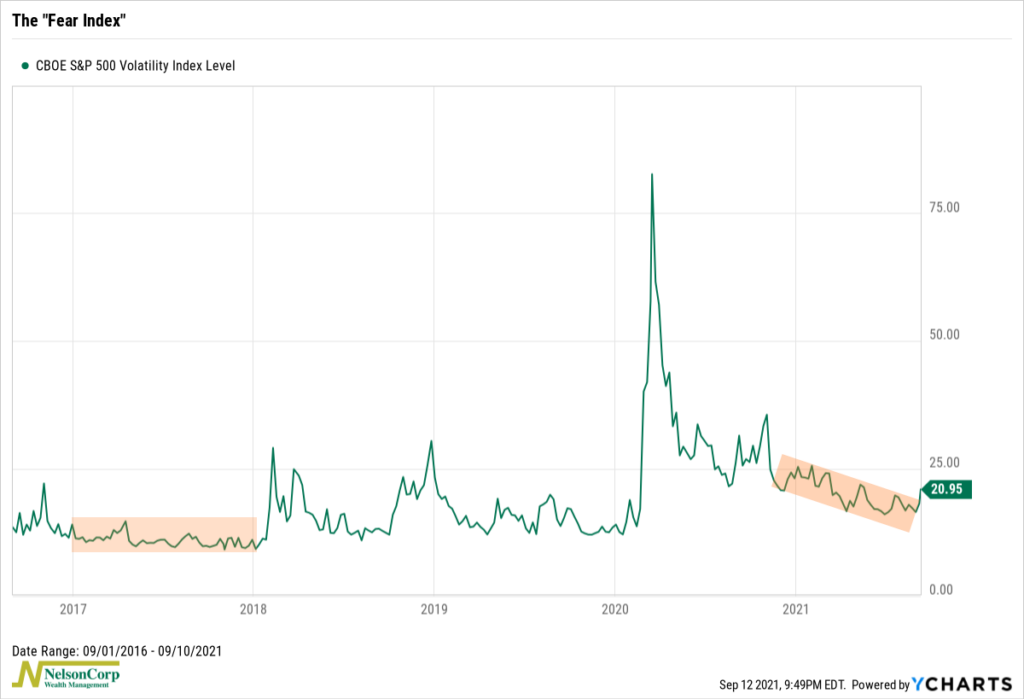
By contrast, although the VIX has fallen consistently this year—ever since its huge spike in March last year—it is still at much higher levels than 2017, closer to the historical average. Plus, I would note that it did jump above 20 last week, a sign that investors expect volatility to be higher over the following month.
Going forward, this will be something to keep an eye on. To be sure, our models still favor an overweight allocation to stocks. But it is worth watching to see if the VIX drops to new lows if a year-end rally occurs.
This is because, historically, when the market makes new highs, but the VIX fails to reach new lows, it’s usually because a selloff is coming. This isn’t always the case, but it is a risk to be aware of.
This is why we advocate for defined risk strategies. If you can define the risk—or limit the risk of loss—for a portion of your portfolio ahead of time, it can be helpful for these types of situations.
This is intended for informational purposes only and should not be used as the primary basis for an investment decision. Consult an advisor for your personal situation.
Indices mentioned are unmanaged, do not incur fees, and cannot be invested into directly.
Past performance does not guarantee future results.
The post Quiet Periods first appeared on NelsonCorp.com.
Securities offered through Registered Representatives of Cambridge Investment Research, Inc., a broker-dealer, member FINRA/SIPC. Advisory Services offered through Cambridge Investment Research Advisors, Inc., a Registered Investment Advisor. Cambridge and CMR Financial Advisors, Inc. are not affiliated. This communication is strictly intended for individuals residing in the states of AZ, CA, CO, FL, HI, LA, MA, MT, NV, OR, VA, and WA. No offers may be made or accepted from any resident outside the specific states referenced.
The information being provided is strictly as a courtesy. When you link to any of these websites provided herein, CMR Financial Advisors, Inc. makes no representation as to the completeness or accuracy of information provided at these sites. Nor is the company liable for any direct or indirect technical or system issues or any consequences arising out of your access to or your use of third-party technologies, sites, information, and programs made available through this site.