OVERVIEW
The U.S. stock market surged higher last week, notching its best week of gains since November 2020. The S&P 500 rose 6.16%, the Dow gained 5.5%, and the NASDAQ soared 8.18%.
International stocks fared well, as well. The MSCI EAFE Index of developed-country stocks rose 5.52, and its emerging markets counterpart increased 3.44%.
Bond prices were mixed. Intermediate-term Treasuries declined 0.77%, and long-term Treasuries dropped 1.05%. However, investment-grade corporate bonds rose 0.59%, and high-yield bonds gained 0.51%. Municipal bonds fell 0.52%, and TIPS sold off around 1.4%.
Real estate had a good week, rising around 2.6%. But commodities dropped, to the tune of about 2.4% overall. Oil fell 2.3%, gold declined 2.8%, and corn decreased 2.72%. And the U.S. dollar weakened by 0.98% to end the week.
KEY CONSIDERATIONS
Pressure Relief – There was a lot of pressure built up in the stock market heading into the Fed’s interest rate meeting last week.
The VIX Index, a measure of volatility or “fear” in the market, rose above 36 on March 7th, more than double the level of roughly 17 where it started the year.
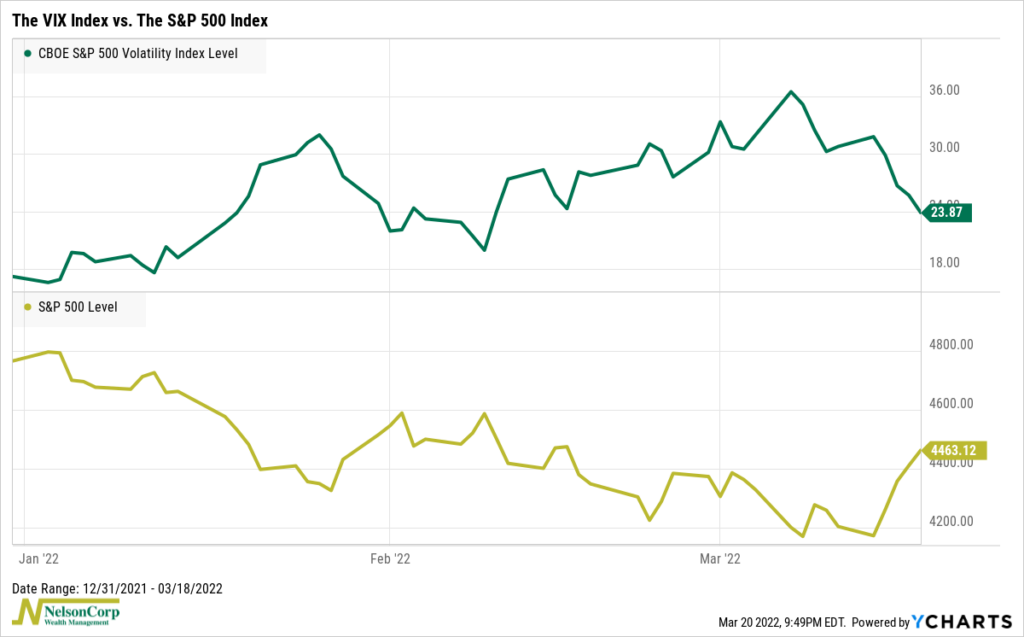
But then the Federal Reserve announced its decision to start raising interest rates last week, opening a pressure relief valve.
The VIX index plummeted below 24, and the major U.S. stock indices notched their best weekly returns since November 2020.
Why? The likely reason was how optimistic the Fed was about the state of the U.S. economy.
The labor market is strong, the Fed said, and the economy should be able to withstand an aggressive rate-hiking cycle that can bring down inflation without inducing an economic downturn.
In other words, the Fed believes it can orchestrate a “soft landing.” But what are the consequences for the stock market going forward?
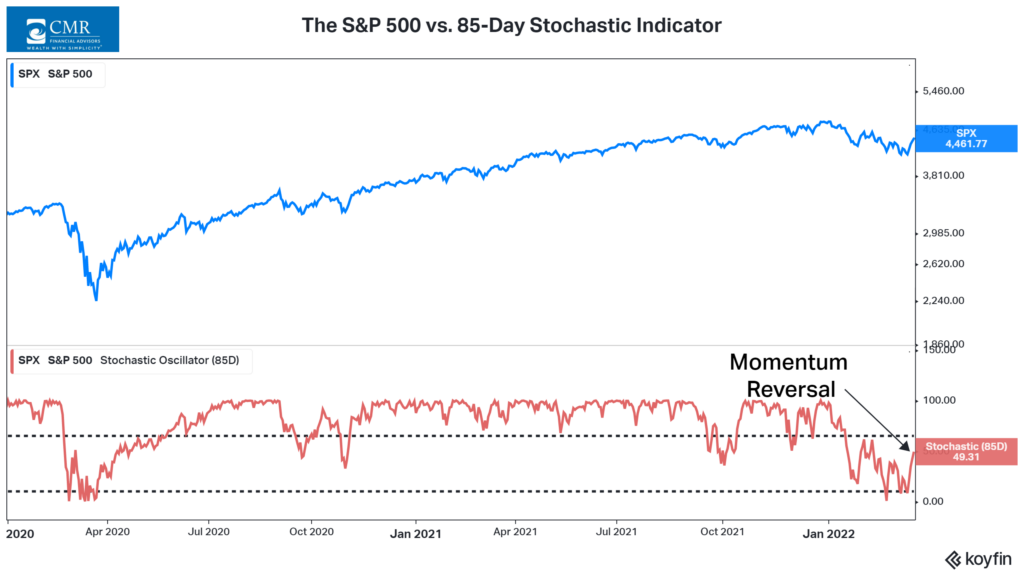
It’s still too early to know for sure, but it does appear that the stock market is trying to turn a corner.
The 85-day stochastic indicator, shown on the chart below, is signaling that the market’s momentum has reached the lower end of its recent trading range and is now ready to turn higher. Again, it’s still early, but this is a positive sign.
On the other hand, however, if we look at global stock price momentum on a consistent basis, things look less encouraging.
The chart below shows the 5-day percentage change of the global stock/bond ratio, smoothed (or averaged) over the past two months.
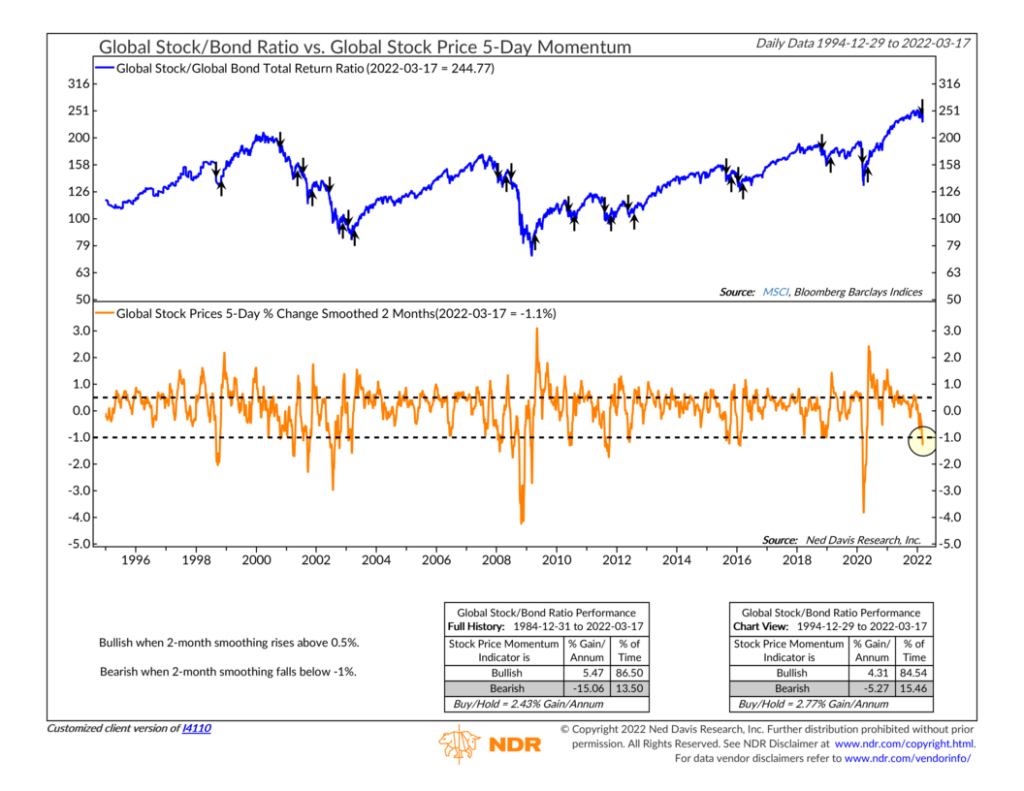
Last week, it reached a reading of -1.1%, which put it in the lower bearish zone on the chart.
Historically, this has meant poor returns for the global stock/bond ratio, meaning bonds tend to outperform stocks on a relative basis when this is the case.
Overall, our composite of price-based indicators, shown on the chart below, remains in a neutral state.
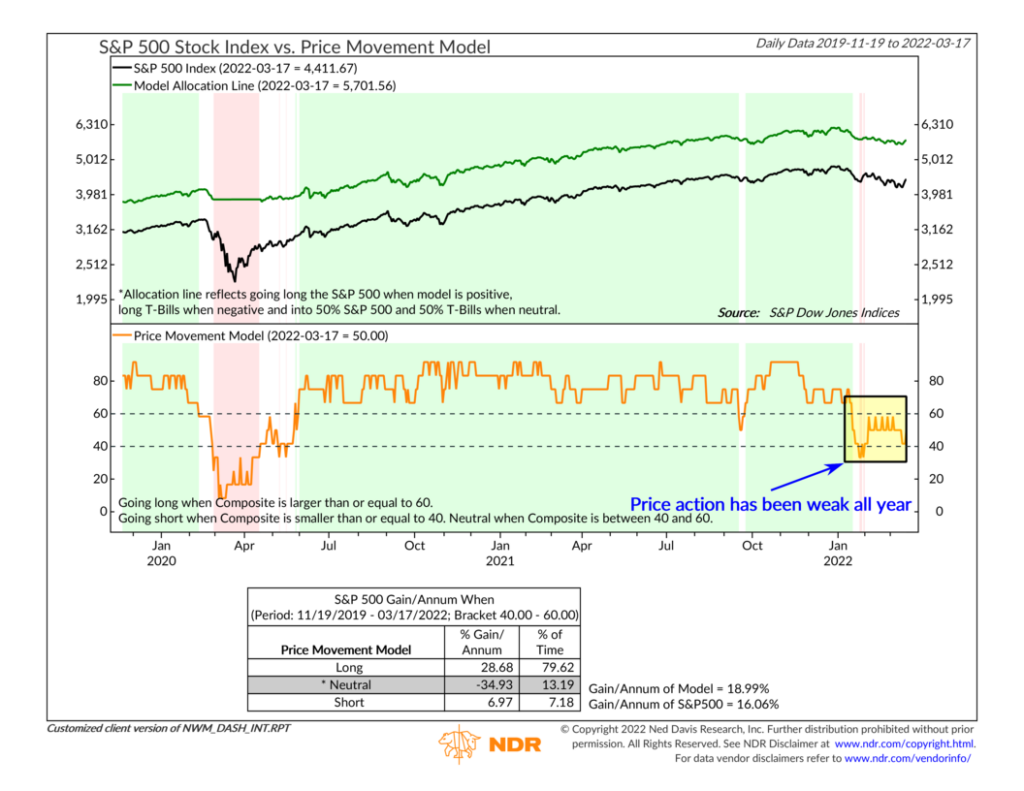
It’s been primarily neutral all year, a sign of just how weak the stock market’s price action has been compared to last year.
We will be looking to see if the relief rally from last week has enough staying power to spill over into the coming weeks. If so, we might start to see some improvement in the price movement section of our model.
In the meantime, however, our indicators mostly suggest that this is still not an environment conducive to a lot of risk-taking.
This is intended for informational purposes only and should not be used as the primary basis for an investment decision. Consult an advisor for your personal situation.
Indices mentioned are unmanaged, do not incur fees, and cannot be invested into directly.
Past performance does not guarantee future results.
The post Pressure Relief first appeared on NelsonCorp.com.