OVERVIEW
The U.S. stock market closed out the first half of the year on a strong note. The S&P 500 rose 1.67% last week and notched its seventh consecutive record close, the longest streak since June 1997.
The other U.S. indices did well, too. The Dow rose 1.67%, and the Nasdaq climbed 1.94%.
However, international stocks were down. Developed countries experienced a decline of 1.15%, and emerging markets dropped 1.75%.
Bonds did well as rates dropped further. Long-term Treasuries rose 2.45%, investment-grade bonds increased 0.81%, high-yield (junk) bonds rose 0.46%, and municipal bonds and inflation-protected Treasuries (TIPS) both gained 0.2%.
Real estate slipped and fell about 0.36%. But commodities did well, rising 2.75% overall. Oil rose 1.35%, gold gained 0.31%, and corn shot up 11.65% for the week.
The U.S. dollar also gained about 0.45% last week.
KEY CONSIDERATIONS
Pause and Decline – Interest rates have been one of the dominant stories so far this year. They started rising quickly near the latter half of last year, catching many market participants by surprise.
Some of this was due to higher inflation expectations—and some was due to higher growth expectations. We’ve seen each come true to an extent in the first half of the year. But will this narrative still hold in the second half?
It’s hard to say.
The chart below shows just how dramatic the rise in rates was. The top half shows the S&P 500 stock index, and the bottom half plots the percentage difference between the 10-year Treasury yield and where we would expect it to be based on its rolling 70-week linear regression line. In other words, it shows how far interest rates are straying from their long-term trendline.
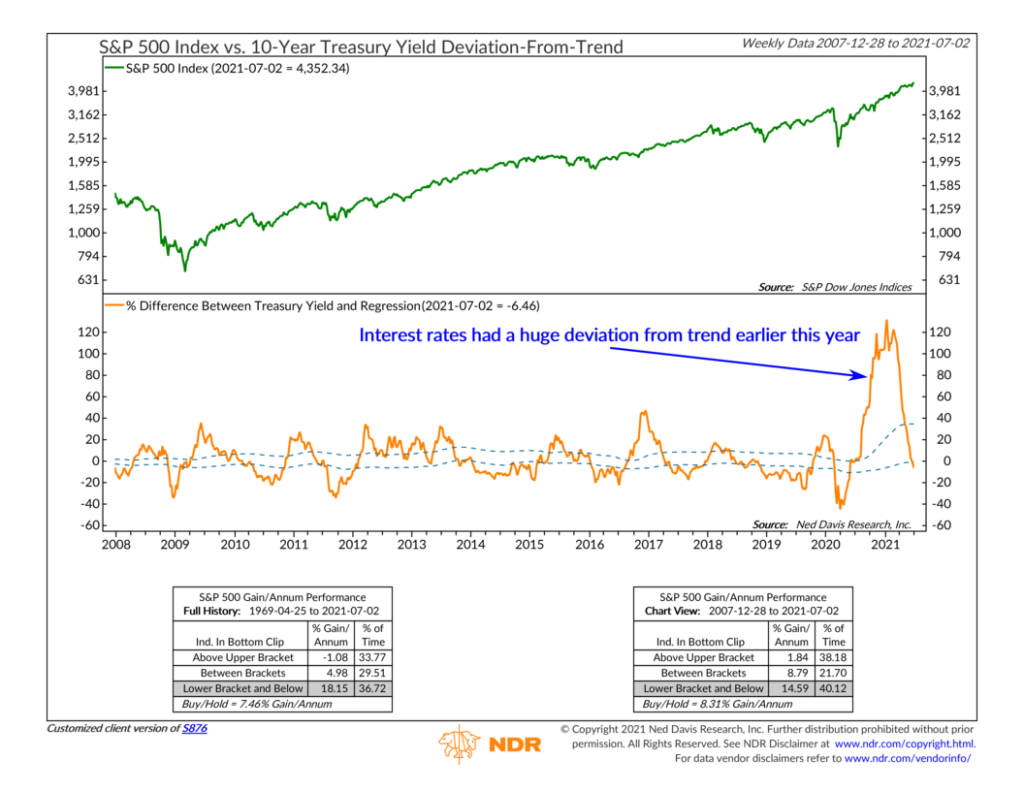
One look at the chart, and you can’t help but notice the enormous deviation recently. That large hump on the far right illustrates just how far rates rose in a matter of a few months.
But, as you might have noticed, the descent from that high was just as startling. The 10-year Treasury rate topped out around 1.7% about three months ago; it’s been trending lower ever since. Our deviation-from-trend indicator now shows that interest rates have fallen below their long-term trend.
So perhaps the narrative is shifting.
According to this indicator, that’ good news. Interest rates trading below trend is historically bullish for the S&P 500 index of large-cap stocks. The index is currently heavily weighted towards many of the bigger tech stocks that generally benefit in a setting where rates are trending lower and economic growth is scarcer than before.
However, this might turn out to be a temporary pause in what some would say is the inevitable rise in interest rates. As the economic cycle matures, it would make sense for rates to continue climbing. If that’s the case, stocks tied to economically-sensitive cyclical sectors—the so-called reopening trade—could see continued outperformance.
That might be a challenging environment for growth stocks, as we saw earlier this year when rates were climbing and the “growthy” tech names were selling off.
But that doesn’t mean all stocks have to suffer. Assuming one’s portfolio is positioned correctly, there will still be opportunities for potential returns in other areas of the market. Being nimble helps.
This is intended for informational purposes only and should not be used as the primary basis for an investment decision. Consult an advisor for your personal situation.
Indices mentioned are unmanaged, do not incur fees, and cannot be invested into directly.
Past performance does not guarantee future results.
The post Pause and Decline first appeared on NelsonCorp.com.