OVERVIEW
U.S. stocks were mostly in the red last week. The S&P 500 Index lost 0.55% and the NASDAQ fell 1.06%. However, the Dow Jones Industrial Average rose about 0.16%. Growth stocks were down around 1.45% on the week, compared to a 0.45% gain for value stocks.
International stocks did well. Developed country markets rose around 0.37%, and emerging markets gained roughly 0.48%.
Bonds, however, had another rough week as interest rates continued to climb. The 10-year U.S. Treasury note’s yield settled around 2.66%, up from 2.4% the week prior. Long-dated Treasuries fell about 2.5% in price. Investment-grade corporate bonds dropped 1.46%, and high-yield (junk) bonds fell 0.82%.
Real assets were mixed. While real estate fell 1.4%, commodities gained about 0.3% broadly. Oil rose 1.7%, gold gained 1.47%, and corn fell 0.28%. The U.S. dollar weakened by around 0.78%.
KEY CONSIDERATIONS
Normalization – A theme that we talked about last week on the blog was the idea that some parts of the economy are starting to return to normal.
For example, as our Chart of the Week pointed out, the personal savings rate for Americans is back to its pre-pandemic level of roughly 7-8%. And credit card debt, which fell significantly during the pandemic, is nearing pre-pandemic levels.
The U.S. economy is also approaching more normal levels of growth. The precipitous decline and subsequent recovery in economic growth due to the pandemic were extreme. But, as the U.S. Federal Reserve Bank of New York’s Weekly Economic Index (WEI) shows on the chart below, growth has been steadily normalizing for a year now.
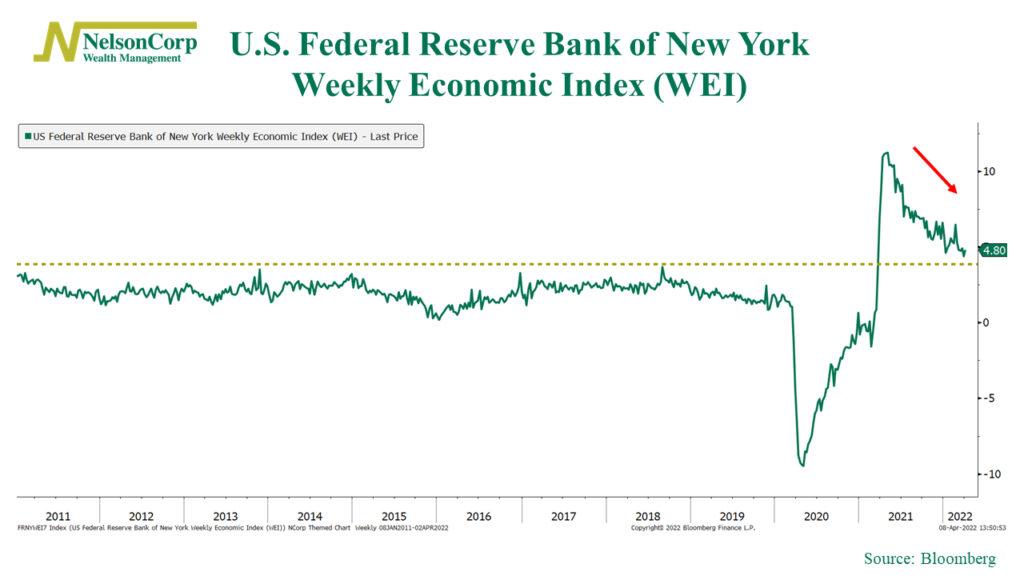
Now, looking at the chart, the slowdown from last year’s peak seems pretty sharp, and it looks a bit concerning.
However, it’s important to note that while many economic indicators seem to be deteriorating by the week, the index is still well above any level of the past decade before March 2021.
In other words, the economic slowdown looks concerning but not necessarily troubling—at least not yet.
Which brings us to our next chart: the Federal Reserve’s balance sheet. As you can see, the total assets held by the Fed roughly doubled during the pandemic. This was a big tailwind for the economy and the stock market.
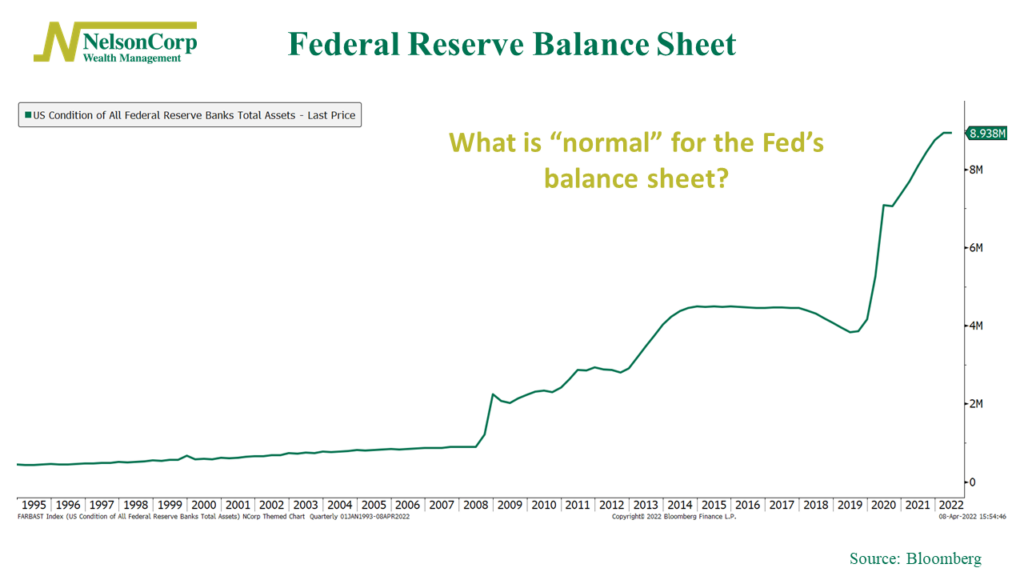
But now, you can say the Fed also wants to get back to normal.
Last week, we learned that the Fed is looking to reduce its balance sheet by roughly $100 billion a month starting sometime this year. Currently, the Fed holds nearly $9 trillion worth of assets on its balance sheet. So, at that pace, it would take more than four years to get back to the roughly $4 trillion pre-pandemic asset level.
With that said, however, I’m not so sure that is necessarily the Fed’s goal. And just looking at the chart, it’s not clear that there is a “normal” level for the Fed’s balance sheet anyway. Mostly, it appears to go up over time, and only briefly has it actually fallen before subsequently resuming its upward climb.
The fact that the Fed is looking to reduce the size of the assets on its balance sheet mainly reflects the idea that it wants to tighten monetary policy and raise interest rates—something it has already started to do. The uncertainty the market is currently grappling with is how far the Fed will have to go in raising rates to quell inflation without wrecking the economy in the process.
And speaking of the market, the S&P 500 index has had quite the run since the pandemic lows in March 2020. The chart below shows the rolling 2-year return of the index, which peaked at a gain of roughly 100% a few weeks ago.
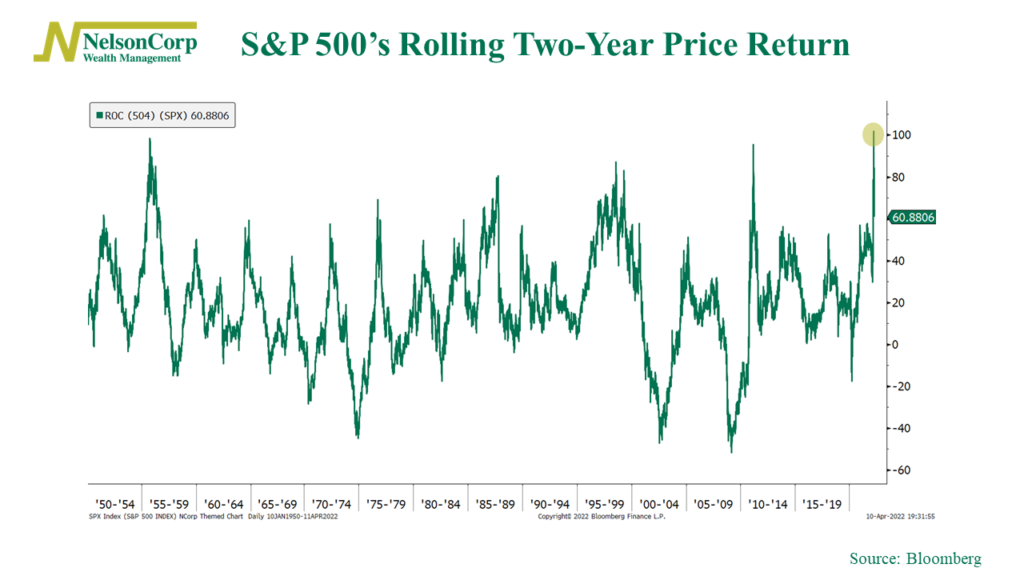
Obviously this was an extreme data point, as it was measured from the very low of the sell-off in March 2020.
But, as the chart makes clear, the market’s 2-year return tends to fluctuate over time, with periods of higher returns followed by periods of lower returns. So, we probably shouldn’t be too surprised if market returns are much lower going forward than we’ve experienced over the past two years.
I’ll end by saying that I don’t think there ever really is a “normal” time for the stock market or the economy. Things are constantly changing. But some things—especially when they get too extreme—come back to more normal levels. We’ve experienced some of this already, and more may still be coming. But at the same time, it will be interesting to see what things have changed once all the dust settles.
This is intended for informational purposes only and should not be used as the primary basis for an investment decision. Consult an advisor for your personal situation.
Indices mentioned are unmanaged, do not incur fees, and cannot be invested into directly.
Past performance does not guarantee future results.
The post Normalization first appeared on NelsonCorp.com.