OVERVIEW
A relief rally hit Wall Street last week as all three major U.S. stock indices ended in the green. The S&P 500 rose 4.7%, up two of the past three weeks. Same with the Nasdaq Composite, which rose 5.2% for the week. And the Dow Jones Industrial Average, up 4.9% for the week, has now risen for three consecutive weeks.
Foreign stock gains were more muted. Developed country stocks increased by around 0.5%, and emerging markets rose by 0.2%.
Treasury bonds had a tough week as the yield on the 10-year Treasury rose to 4.23% from 4.02% the week before. Intermediate-term Treasuries lost 1%, and long-term Treasuries fell 5.5%. While investment-grade corporate bonds declined 1.2%, high-yield (junk) bonds gained 0.3% for the week. Municipal bonds were down over 1%, and TIPS lost 0.34%.
Real estate was up on the week by the tune of about 2.6%. Commodities, however, fell about 2.1% broadly. While oil rose 0.57% and gold gained 0.45%, corn declined roughly 0.8%. And the U.S. dollar weakened by about 1.15% against the world’s major currencies.
KEY CONSIDERATIONS
Market Mourning – It’s been a tough year for the stock market. January 3rd was the last time stocks were at an all-time high. That was about 290 days, or nearly 10 months ago.
10 months. What’s interesting about that time frame is that it’s getting close to the interval of time associated with an old indicator known in the financial world as the “Coppock Curve.”
Edwin Coppock first introduced this indicator in the early 1960s. He called it his “Very Long-Term Momentum Indicator.”
Long-term because it’s calculated by taking the 10-month weighted moving average of the sum of the 14-month rate of change and the 11-month rate of change of an index like the S&P 500 stock index.
In other words, it looks at where the stock market is today versus 11 months ago and 14 months ago (expressed as a percentage) and then adds those terms together and weights them with the most recent months getting the most weight.
But why 11 and 14 months?
That’s where it gets interesting. As a money manager, Mr. Coppock managed investments for the Episcopal Church in the United States. During a discussion with a priest one day, the priest stated that it generally takes a person 11 to 14 months to mourn the loss of a loved one. Figuring that human psychology might work the same way in terms of a large investment loss, Coppock incorporated that time frame into his indicator.
The point of the analysis is that it helps identify long-term turning points in the market. In a prolonged bear market, it can even help discover meaningful long-term buying opportunities.
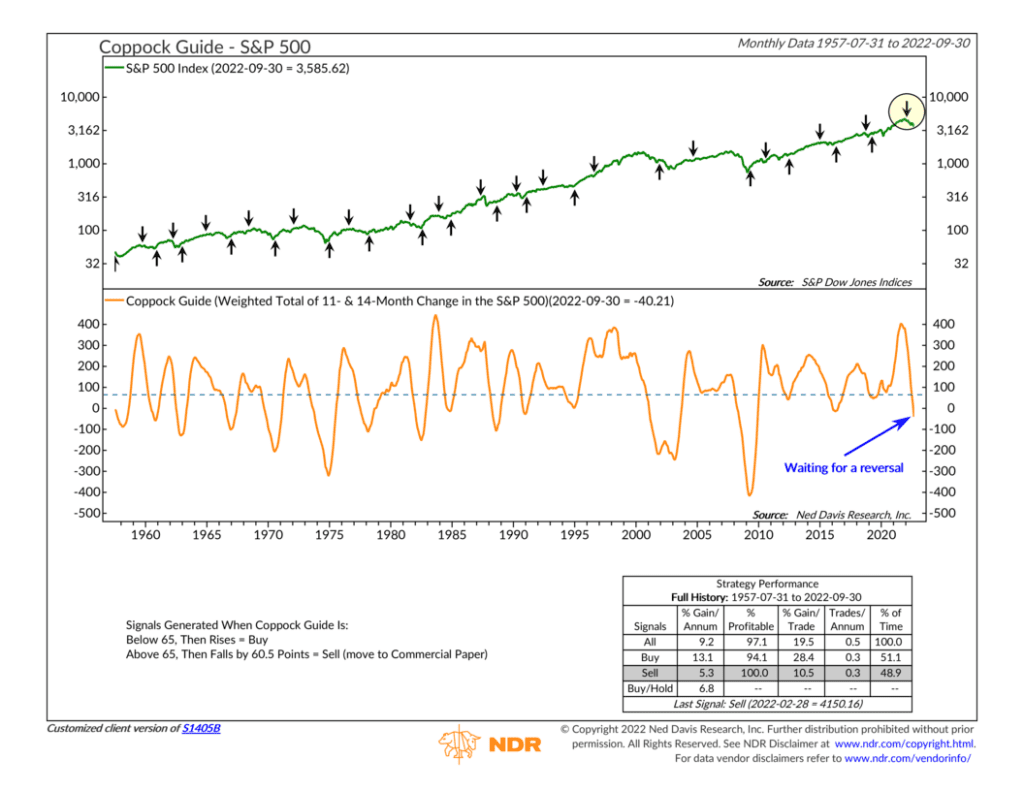
As the chart above shows, the Coppock Curve triggered a sell signal at the beginning of the year when the market started rolling over. And now, the indicator is at its lowest level since the 2007-2009 bear market, a sign that long-term momentum has declined considerably.
However, it’s clear that the line is still falling, meaning long-term momentum is still declining. Historically, the rules of the indicator say we need to see the Coppock Curve bottom and turn up before it signals a turning point in the bear market.
We’re not there yet. We could be getting closer. But looking at the chart, the market would still need to decline further before it signals one of those big, juicy historical bottoms like we’ve seen in the past.
This is intended for informational purposes only and should not be used as the primary basis for an investment decision. Consult an advisor for your personal situation.
Indices mentioned are unmanaged, do not incur fees, and cannot be invested into directly.
Past performance does not guarantee future results.
The post Market Mourning first appeared on NelsonCorp.com.