OVERVIEW
Volatility picked up a bit on Wall Street last week, leaving the major U.S. indices in negative territory. The S&P 500 fell 0.96%, the Nasdaq fell 0.69%, and the Dow dropped 0.57%.
Foreign stocks had a similarly poor week, with developed country stocks falling about 0.5% and emerging market stocks dropping about 0.2%.
Bonds had a better week. The 10-year U.S. Treasury note’s yield fell to about 0.89%, down from last week’s 0.97%.
Commodities had a good week, despite the roughly 0.3% gain in the U.S. dollar. Oil rose over 1%, gold rose around 0.1%, and corn gained about 0.7%.
Real estate had a poor week, dropping about 2.3%.
KEY CONSIDERATIONS
Idling in the Right Gear – The U.S. stock market rally was put on pause last week. High spirits among investors pushed prices to slightly overbought levels, as evidenced by the 32-day Stochastic Oscillator below.
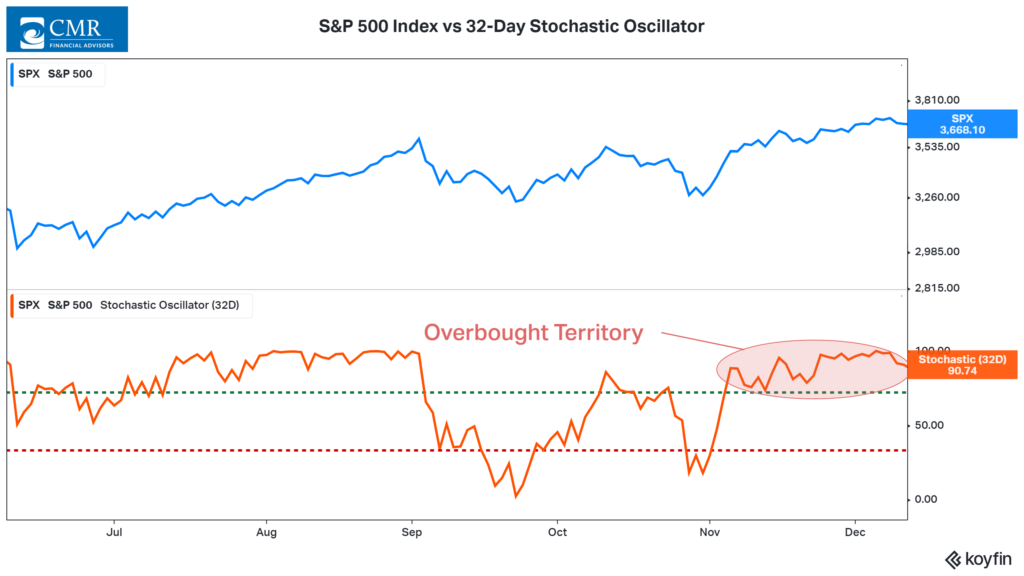
When this indicator shows the stock market trading above the upper green line for a prolonged period, a pullback becomes more likely.
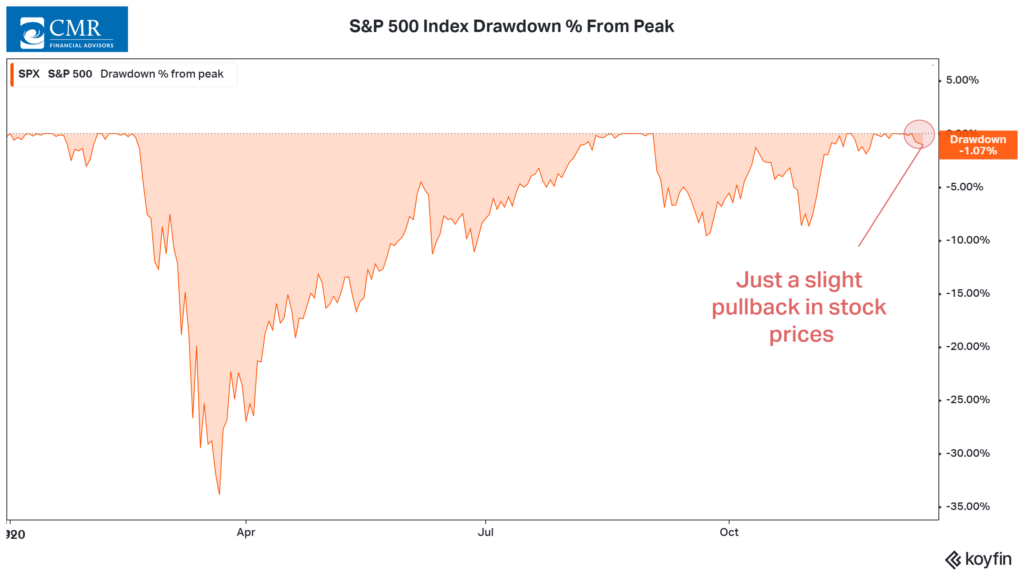
However, the stock market hit fresh new highs just last week, meaning the trend in stock prices remains strong. Looking at the chart of the S&P 500’s percentage drawdowns from a recent peak, this latest pullback barely registers on the chart.
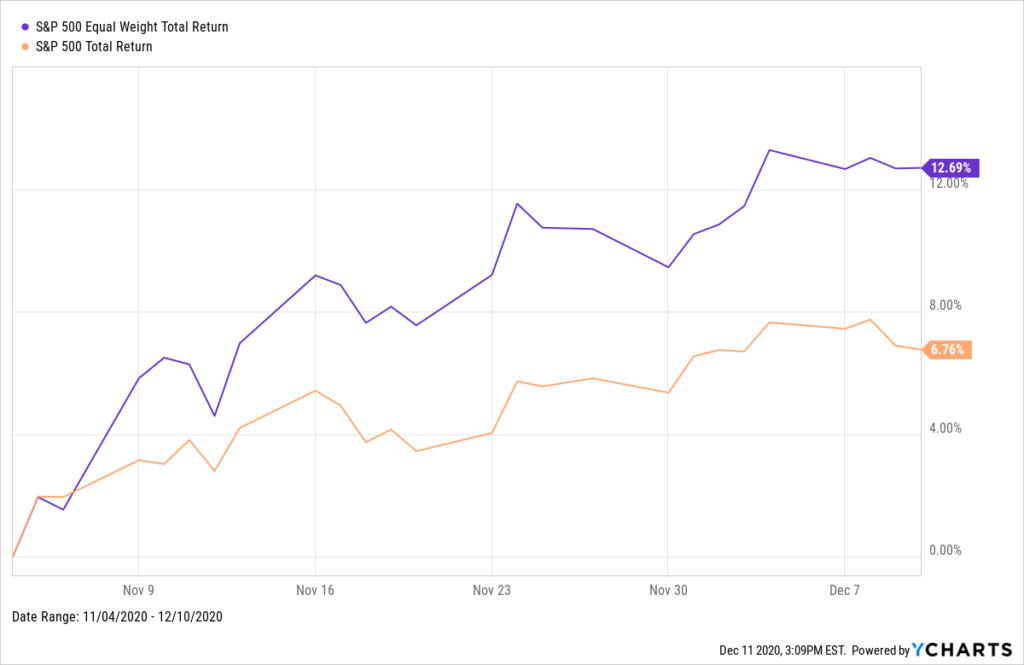
What we find is that the internal strength of the market has improved dramatically in recent weeks.
It’s no longer just a few high-flying stocks holding up the broader market. Since the beginning of November, the equal-weighted version of the S&P 500 has outperformed the market-cap-weighted version by nearly double.
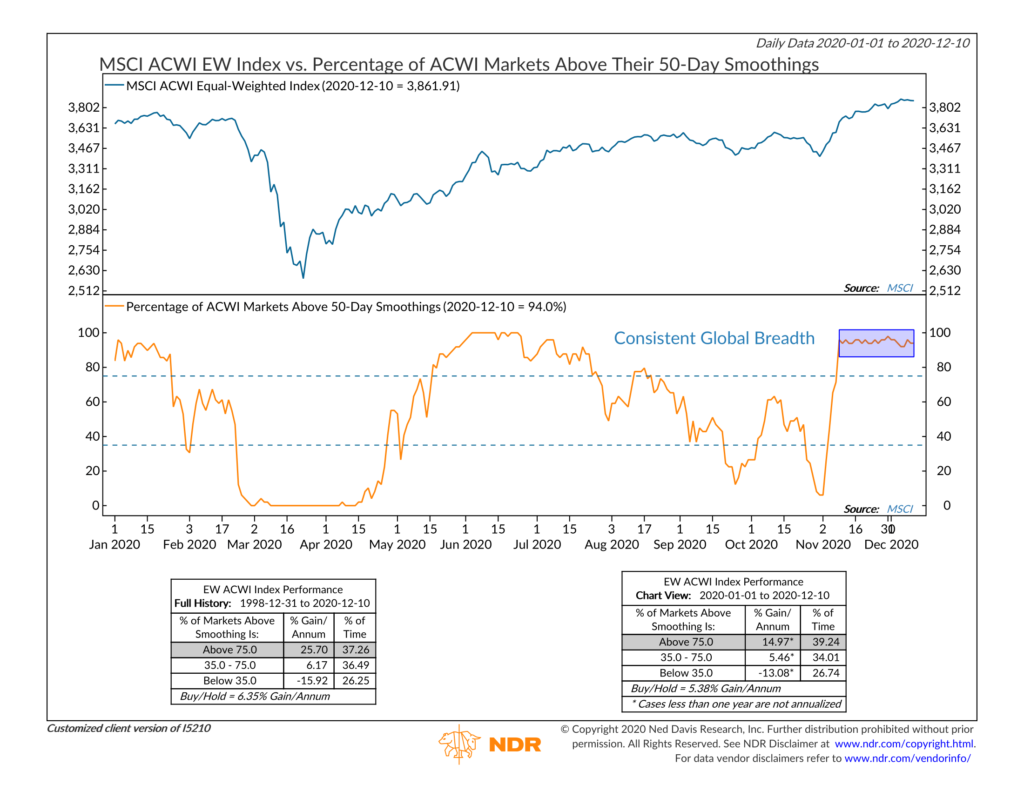
This means that breadth — or participation — has gotten much better, which is the same story that global stocks are telling us. After dropping to virtually zero roughly a month ago, the percentage of ACWI markets above their average 50-day price has skyrocketed to over 90 percent — and it has stayed remarkably consistent at these levels the whole time!
To see just how bullish breadth has gotten, we also look at a High-Low Logic indicator. This indicator essentially tells us whether the market is “in gear” or not by adding the lesser of weekly new highs and new lows and dividing that figure by the weekly total number of stocks traded.
High readings are bad, indicating bad breadth, and low numbers are good, indicating good breadth.
As the chart shows, when the market was reaching new highs earlier this year (before the sell-off in March), the market was not only delivering a lot of stocks hitting new highs but also a lot of stocks hitting new lows.
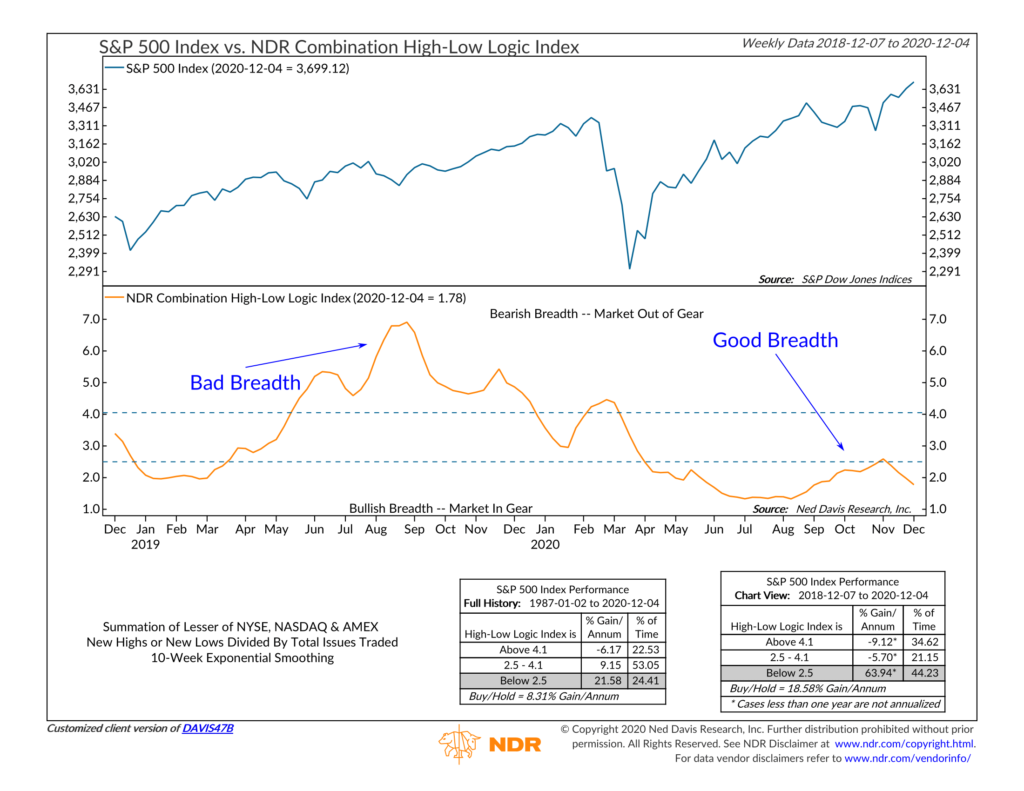
However, this time around, the indicator has fallen below 2 percent, indicating that plenty of stocks are making new highs without a similar number of new lows.
In other words, the market is “in gear,” and historically, the returns to the S&P 500 have been excellent when this is the case.
This is intended for informational purposes only and should not be used as the primary basis for an investment decision. Consult an advisor for your personal situation.
Indices mentioned are unmanaged, do not incur fees, and cannot be invested into directly.
Past performance does not guarantee future results.
The post Idling in the Right Gear first appeared on NelsonCorp.com.