OVERVIEW
The major U.S. stock indices were mixed in performance last week, with the S&P 500 gaining 1.73 percent, the Nasdaq Composite gaining 3.69 percent, and the Dow Jones Industrial Average dropping 0.16 percent.
International stock markets were similarly mixed, with emerging markets gaining 1.74 percent, and developed countries dropping 2.13 percent.
U.S. interest rates dropped further last week, with the 10-Year Treasury yield settling around 0.53 percent.
Bonds rallied across the board, with the largest gains centered among long-term Treasuries, high-yield bonds, and TIPS.
Real estate climbed roughly four percent for the week.
Commodities were up and down, with gold rallying 3.15 percent and oil and corn dropping.
And finally, the U.S. dollar continued to weaken, dropping about 0.86 percent to end the week.
KEY CONSIDERATIONS
Green Means Go! – The stock market continues to march forward. And each week that the rally holds itself together, we see more green lights confirming the internal strength of the trend.
For instance, in the early days of this rally, a large chunk of the market’s strength was driven by a smaller number of mega-cap tech stocks. However, while still the case, the rest of the market has begun to catch up.
For example, up until just a few days ago, the materials sector of the S&P 500 (which has the lowest weighting in the index) was the best performing sector over the past three months.
But it’s more than just that. As the chart below shows, the number of stocks above their 200-day average price has risen to just under 50 percent.
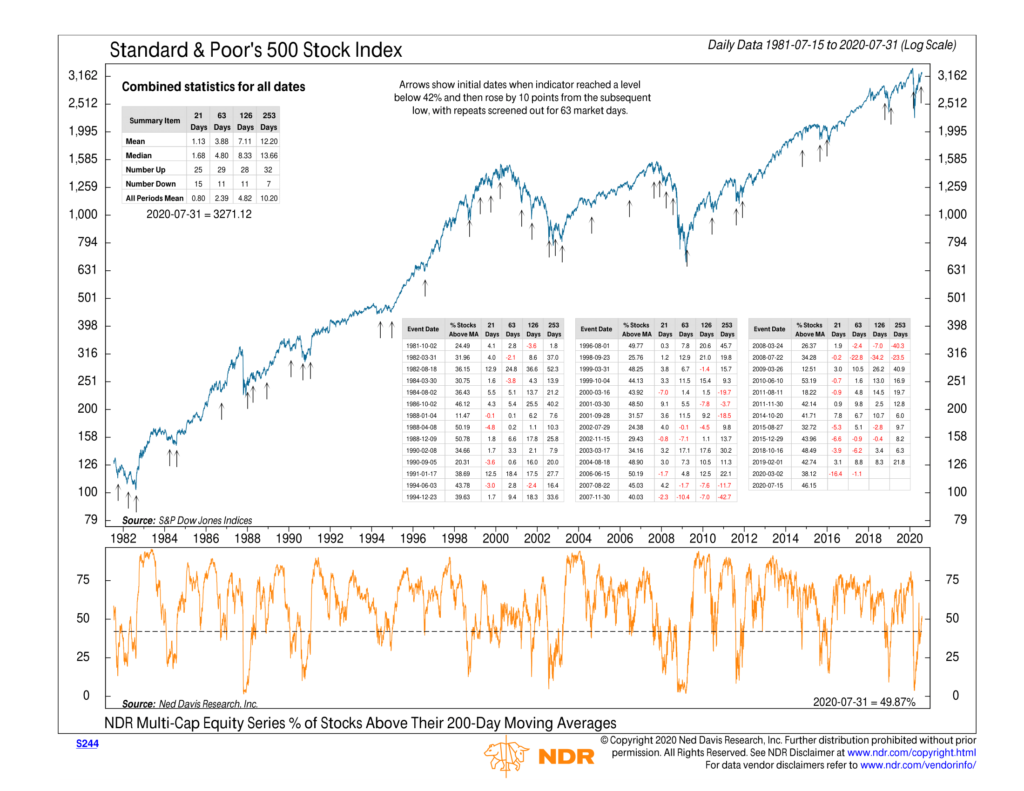
A bullish signal was triggered on this indicator in mid-July as this measure climbed more than 10 points from a previous low. Historically, after a bullish signal like this one, the stock market has gained roughly double what it usually returns in the ensuing few months.
Temperature Check – Ok, so breadth has improved. But what about sentiment? Has this rally reached a stage of excessive optimism? Said differently, Are investors complacent?
Here the evidence is more mixed. From a high view, a composite of several indicators shows that we’ve seen sentiment reach slightly excessive levels a few times over the past two months, but it failed to stay there for much longer than a week.
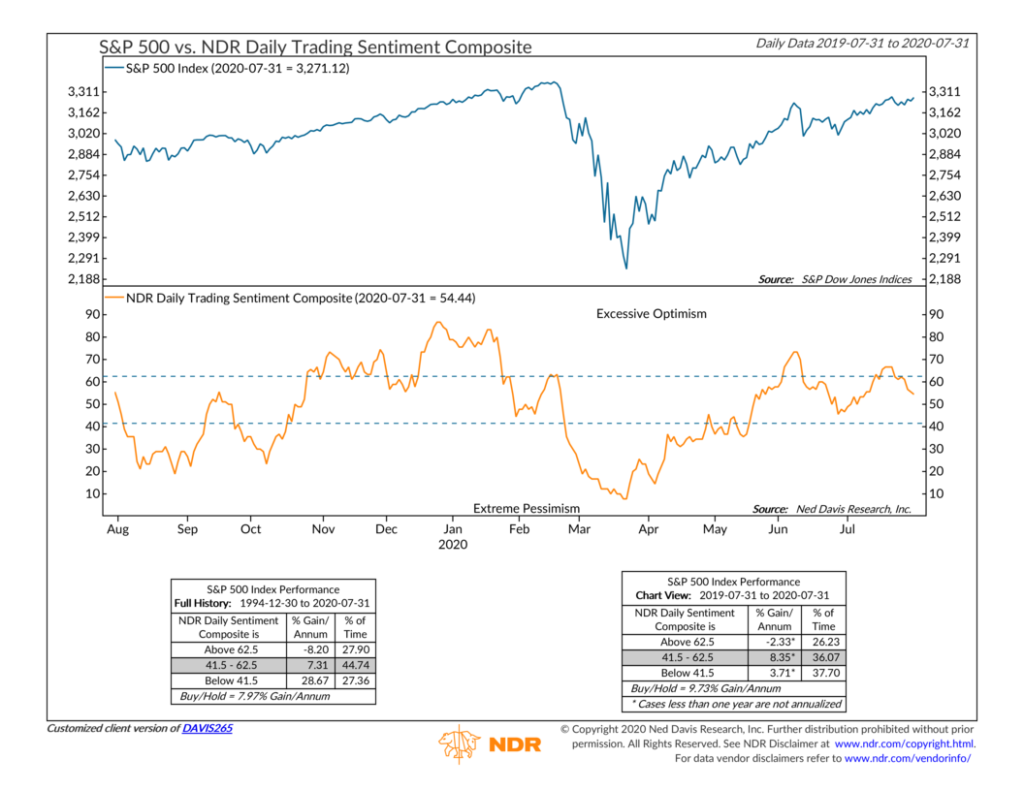
By comparison, in the run-up to the market crash earlier this year, this indicator consistently showed excessive optimism for roughly a month and a half before faltering a month before the decline.
We can also drill down to a more specific sentiment indicator. The AAII survey indicator shows the percentage of respondents who are bullish on stocks over the next six months. The reading is currently low but rising relative to its longer-term average — a bullish condition for stocks.
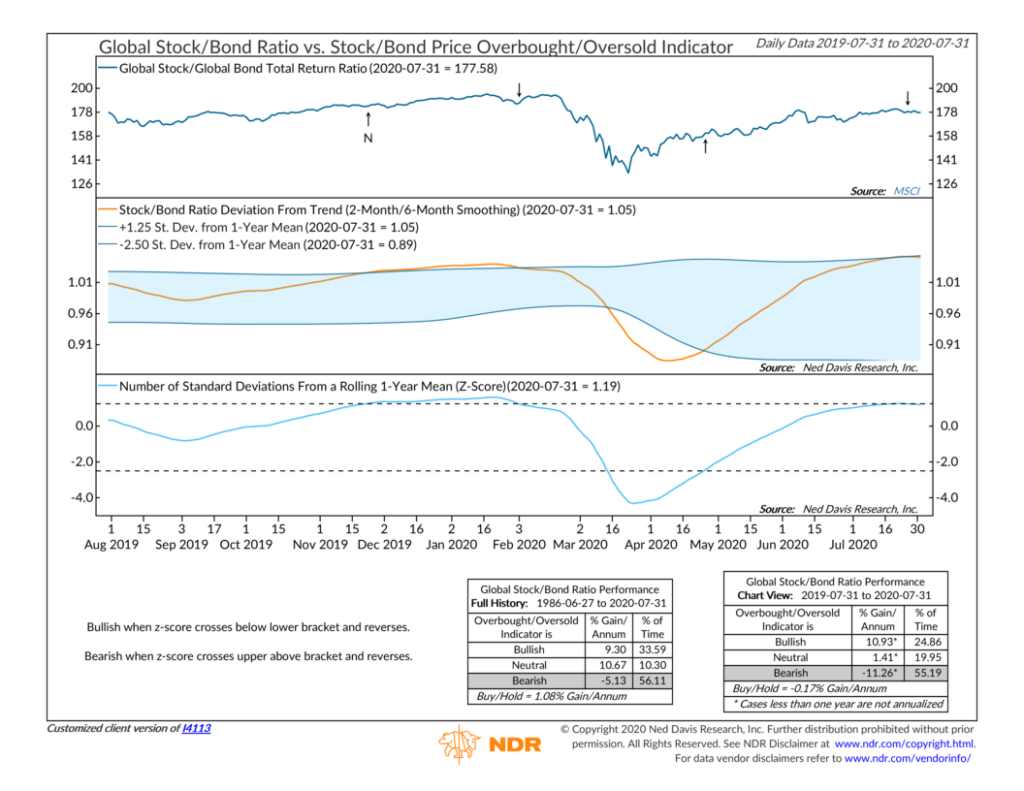
On the other hand, while things look bullish for the U.S. stock market, there are signs that global stocks have reached overbought levels compared to bonds.
The global stock/bond ratio has leveled out in recent months, and last week we received a sell signal for global stocks.
To be sure, the weight of the evidence is decidedly bullish. But we are always looking out for any risks that could materially change the landscape going forward.
This is intended for informational purposes only and should not be used as the primary basis for an investment decision. Consult an advisor for your personal situation.
Indices mentioned are unmanaged, do not incur fees, and cannot be invested into directly.
Past performance does not guarantee future results.
The post Green Means Go! first appeared on NelsonCorp.com.