OVERVIEW
The U.S. stock market ended a choppy week of trading with slightly positive gains. The S&P 500 rose 0.2 percent, the Dow was mostly flat, and the Nasdaq climbed about 0.8 percent.
Developed country stocks did poorly, declining nearly 1.4 percent on the week. Emerging market stocks, however, rose about 0.3 percent.
The yield on the 10-year Treasury note fell to 0.75 percent by the end of the week, resulting in gains for intermediate and long-dated Treasury bonds.
Investment-grade bonds rose around 0.4 percent, but high-yield bonds ticked lower by a few basis points.
Gold fell about one percent on the week, dragging the broader commodity indices lower. However, grains had a good week, with the Bloomberg Grains Subindex rising about 3.5 percent.
And finally, the U.S. dollar rose a bit over half a percent for the week.
KEY CONSIDERATIONS
Finding the Right Speed – Despite a somewhat bumpy week, the weight of the evidence remains bullish for the stock market.
Much of this is due to the ongoing strength of Big Tech.
The Information Technology component of the MSCI All-Country World Index continues to show strong technical strength, closing above both its 50-day and 200-day average price. Additionally, roughly 73 percent of the stocks in the index are above their respective 200-day average prices.
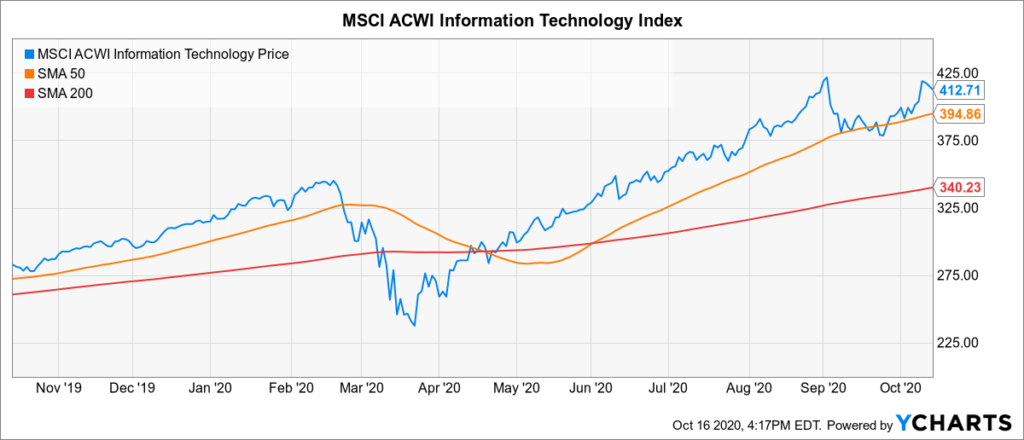
Because these massive technology-focused companies make up such a huge percentage of the stock market’s total market capitalization, when they do well, the major market indices usually do well, too.
But this masks the fact that roughly 53 percent of the stocks in the S&P 500 stock index are down on the year!
Complacency breeds risk. So what else should we be looking out for?
Well, for starters, we see that the intermediate-term (6-month) returns of the S&P 500 stock index have peaked and reversed over the past month.
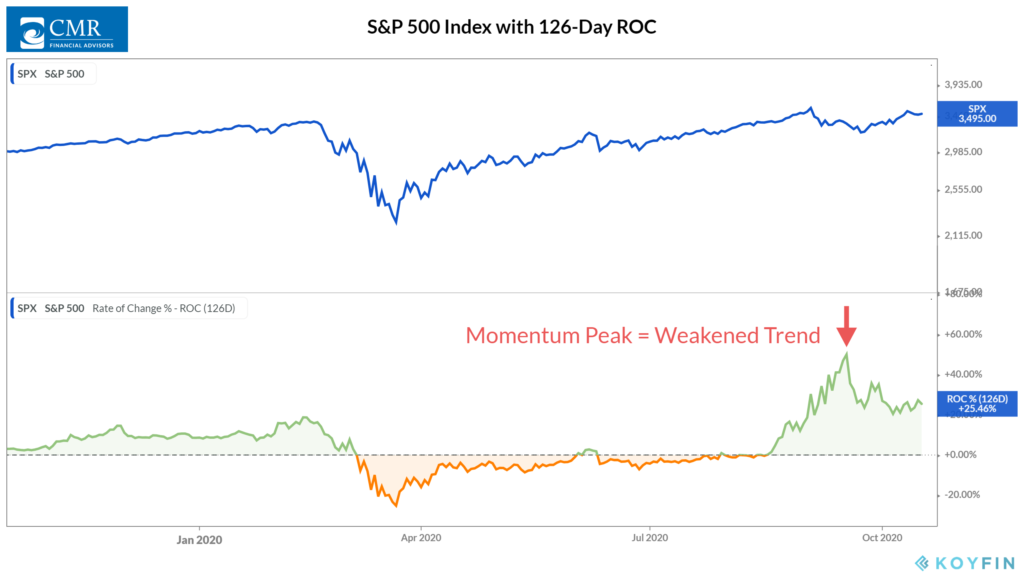
More so, returns for the index over the past four months have weakened significantly relative to returns over the past seven months. This deviation in the trend of prices tends to be negative for stock returns going forward.
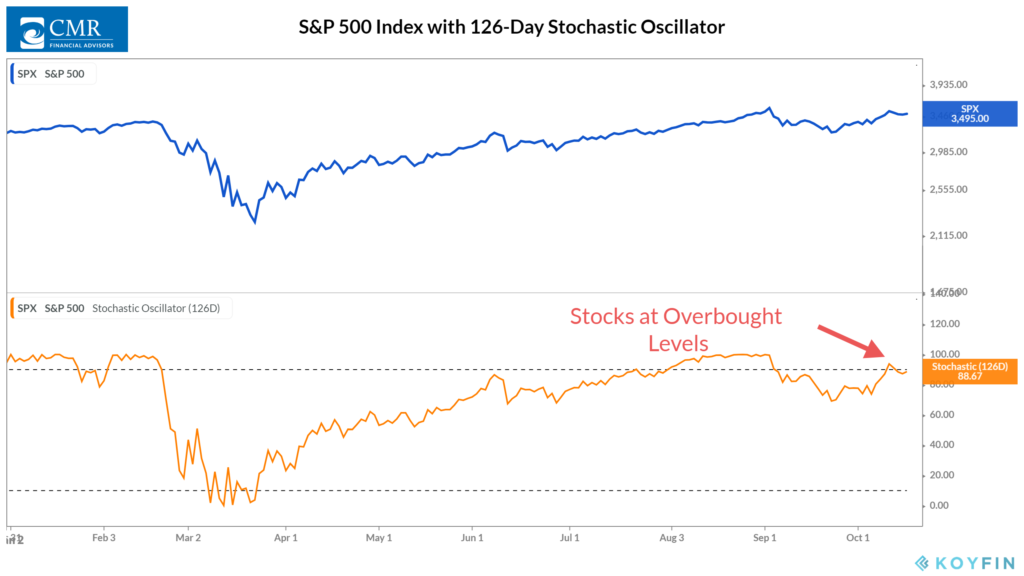
Additionally, we see signs that stock returns have reached such excessive levels that a reversion to a lower level is more likely.
For example, the 126-day (6-month) Stochastic Oscillator is a fancy tool that we use to tell when stock returns have reached overbought (too high) levels. As the chart shows, it continues to flirt with the upper bracket, a bearish signal.
The takeaway: Stocks have had such a monster rally since the March lows that some weakness is expected at these levels.
To be sure, the weight of the evidence remains mostly positive. But risks have elevated to the point that leaning against the wind somewhat is a sensible way to manage uncertainty at this time.
This is intended for informational purposes only and should not be used as the primary basis for an investment decision. Consult an advisor for your personal situation.
Indices mentioned are unmanaged, do not incur fees, and cannot be invested into directly.
Past performance does not guarantee future results.
The post Finding the Right Speed first appeared on NelsonCorp.com.