OVERVIEW
The U.S. stock market had another down week last week. After a 0.93% drop, the S&P 500 has now fallen in 12 of the last 15 weeks. The Dow edged lower 0.16%, and the Nasdaq dropped 1.57%.
Growth stocks pulled the market lower, with the Russell 3000 Growth index dipping 1.33%. The Russell 3000 Value index fell around 0.83%. Small-cap stocks fell around 0.6%.
Foreign stock markets also felt the heat last week. The MSCI EAFE index of developed country stocks dropped 1.75%, and the emerging market index plummeted 3.77%.
Bonds had a good week as the 10-year Treasury’s yield dropped to 2.92%, down from 3.1% the week prior. Intermediate-term Treasuries gained 0.93%, and long-term Treasuries surged 3.4%. Investment-grade corporates gained 1.06%, and high-yield bonds rose 0.26%. Municipal bonds were up 0.75%, and TIPS increased 0.98%.
Commodities continued to cool off, with the Bloomberg Commodity Index falling 2.11% for the week. Oil plummeted over 6%, gold dropped 1.37%, and corn fell 4.6%.
Not helping commodities has been the incredible surge in the dollar this year. It rose another 1% last week and is now up nearly 13% for the year.
KEY CONSIDERATIONS
Finding the Right Gear – One thing we like to look at when measuring the stock market’s health is whether it’s “in gear” or not.
What does it mean to be in gear? Basically, it means the individual stocks in the market are all moving together, whether up or down. Historically, this is a bullish condition for stocks.
But when the market is churning or out-of-gear, it means many stocks are breaking out to new highs while many others are breaking out to new lows. When this happens, the overall stock market tends to struggle.
To measure this, we use a breadth indicator called the High-Low Logic Index, shown as the orange line on the chart below. The technical definition is that it calculates the 10-week exponential moving average of the lesser of new highs and new lows, divided by total issues traded. When it’s high, it means the market is churning and out of gear. When it’s low, that’s a sign the market is moving together and in gear.
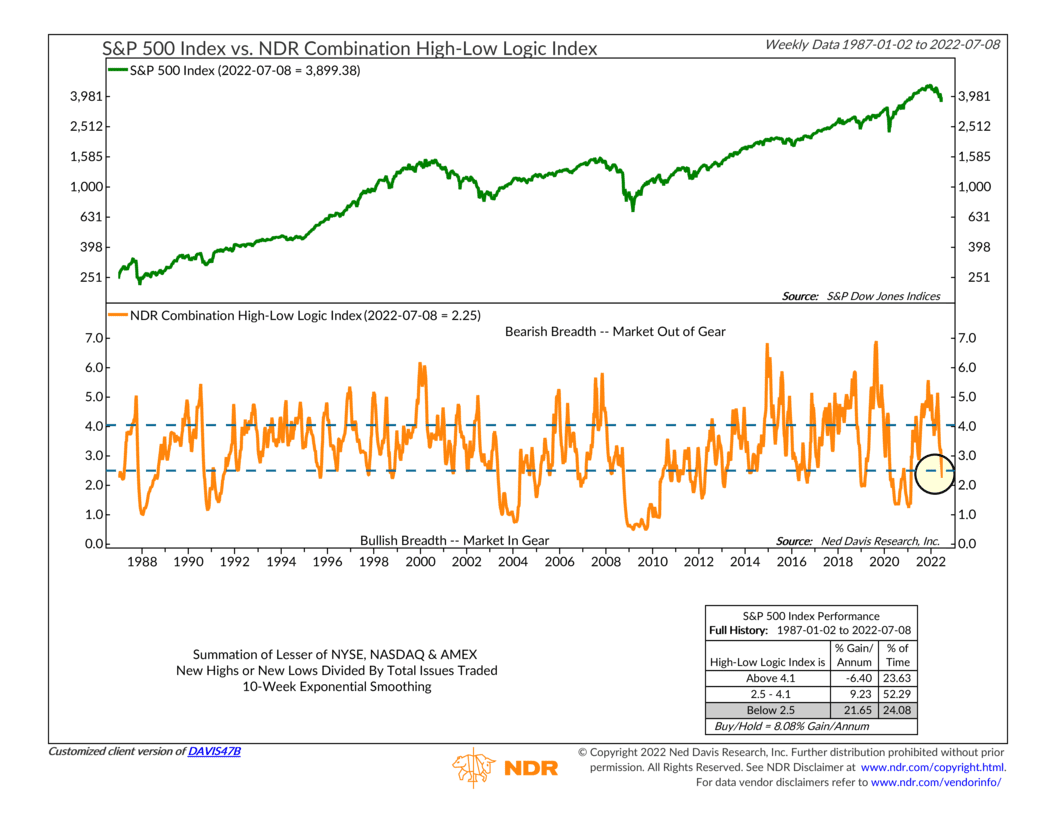
As I’ve highlighted on the chart, the indicator recently moved into the lower zone, indicating an in-gear market. Historically, the S&P 500 (green line) has risen at a 21% per annum pace since 1987 when this is the case.
So, the main takeaway is that we are finally starting to see some capitulation in the market, with a lack of stocks making new highs and the most new lows since the 2020 bottom. Current conditions suggest we could perhaps see a relief rally here.
With that said, however, there is still room for this indicator to improve. The High-Low Logic metric is just barely in a bullish zone. To distinguish between a bear market rally and a sustainable rally, we would like to see some actual strength in the market’s price action—perhaps even some breadth thrusts to the upside.
This type of improvement would show up in another indicator, shown below, that combines various indicators that measure market rallies. It’s called a Rally Watch Report, and when the percentage of bullish indicators in the report rises above 50%, it’s a sign that the overall stock market is set to rally.
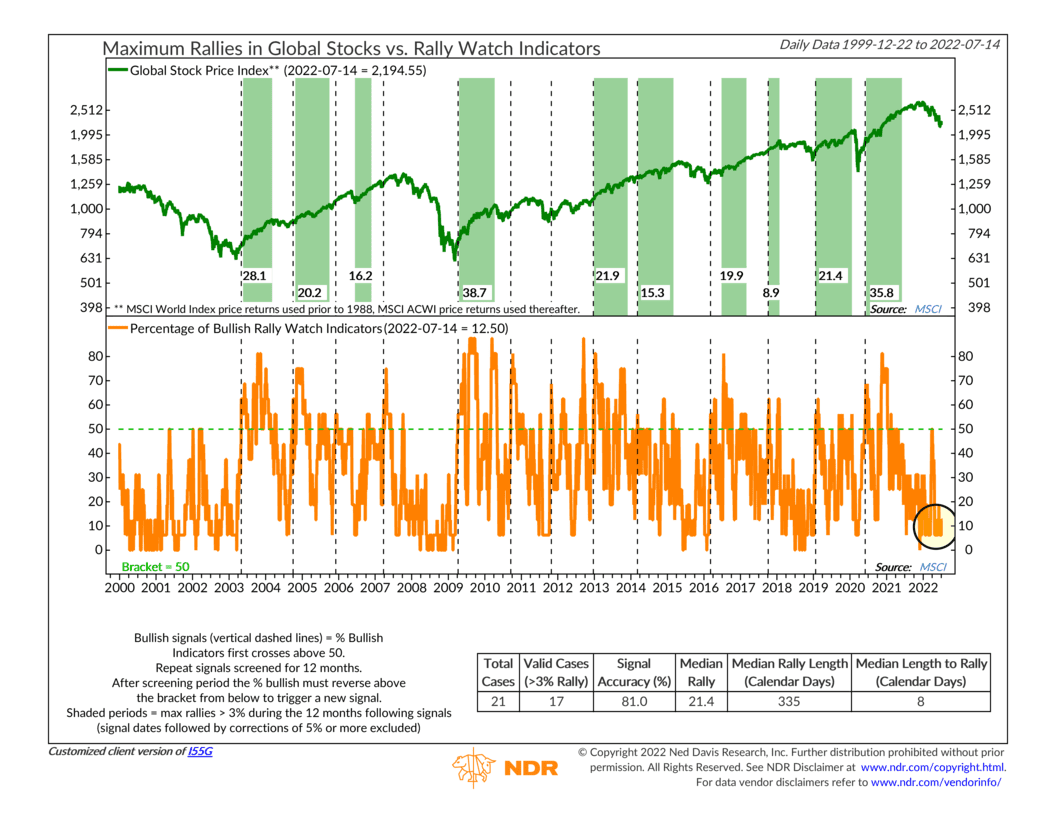
But, as you can see, it’s nowhere close to triggering a bullish rally signal. Only 12.5% of the rally watch indicators are bullish.
The two that are bullish are sentiment-based indicators, meaning there’s a lot of pessimism in the market, which is a good thing from a contrarian standpoint.
However, the other 14 price-based indicators still have some work to do. If we can get some improvement in these breadth and trend price-based components, then the market could be set up for a rally at some point in the future; this is something we’ll be watching on our radar.
This is intended for informational purposes only and should not be used as the primary basis for an investment decision. Consult an advisor for your personal situation.
Indices mentioned are unmanaged, do not incur fees, and cannot be invested into directly.
Past performance does not guarantee future results.
The post Finding the Right Gear first appeared on NelsonCorp.com.