OVERVIEW
The U.S. stock market broke its two-week losing streak last week as the S&P 500 rose 0.51%, the Dow gained 0.62%, and the Nasdaq rose a meager 0.02%.
Small-cap stocks had a good week, climbing about 1%. Value stocks rose around 0.66%, outpacing growth’s gain of roughly 0.32%.
International stocks were down. Developed countries dropped 0.29%, and emerging markets fell 1.11%.
The U.S. 10-year Treasury note yield surged to 1.45%, up from 1.37% the previous week. Long-term Treasuries fell 1.52%, investment-grade corporates dropped 0.35%, high-yield (junk) bonds declined 0.13%, municipals fell 0.15%, and inflation-protected Treasuries decreased 0.68% to end the week.
Real estate didn’t fare much better, falling 1.48% for the week. Commodities, however, had a good week, with the broad index logging a 1.47% gain. Oil rose nearly 3%, gold remained roughly flat, and corn fell about 0.09%. The U.S. dollar strengthened by about 0.12%.
KEY CONSIDERATIONS
Filling the Buckets – From problems with Chinese real estate developers to concerns over Federal Reserve tightening, it certainly feels like there are a lot of macroeconomic risks floating around out there. It feels like that because, well, there are.
However, even though we recognize the importance of tracking the macro factors shaping the broader investing environment, we believe there is no need to react to all—or some, or even any—of these changes as they occur. Our research-driven process allows us to stay level-headed in the face of macro shifts. New information is digested and processed through the lens of our indicators, which in turn drives our models.
I like to think of it as filling buckets. As more and more indicators change in either a positive or negative direction, buckets get filled that correspond to some factor that we feel is an important driver of stock market returns. Once a bucket gets full enough, it can tip over and change the overall model in a more positive or negative direction.
Take liquidity, for example. It’s been shown that more financial liquidity (money) in the system is good for stock market returns. Since February 2020, the Federal Reserve has ballooned its balance sheet to over $8.4 trillion, more than double where it was previously. That’s why the liquidity “bucket” in our primary stock market risk model has been full of positive liquidity indicators for some time now, and this has helped bolster stock market returns even in the face of adverse macroeconomic events.
Here’s another way of looking at just how much liquidity is currently in the system. Below is a chart of the total reverse repurchase agreements held by all the Federal Reserve Banks. It recently hit a record high of $1.56 trillion.
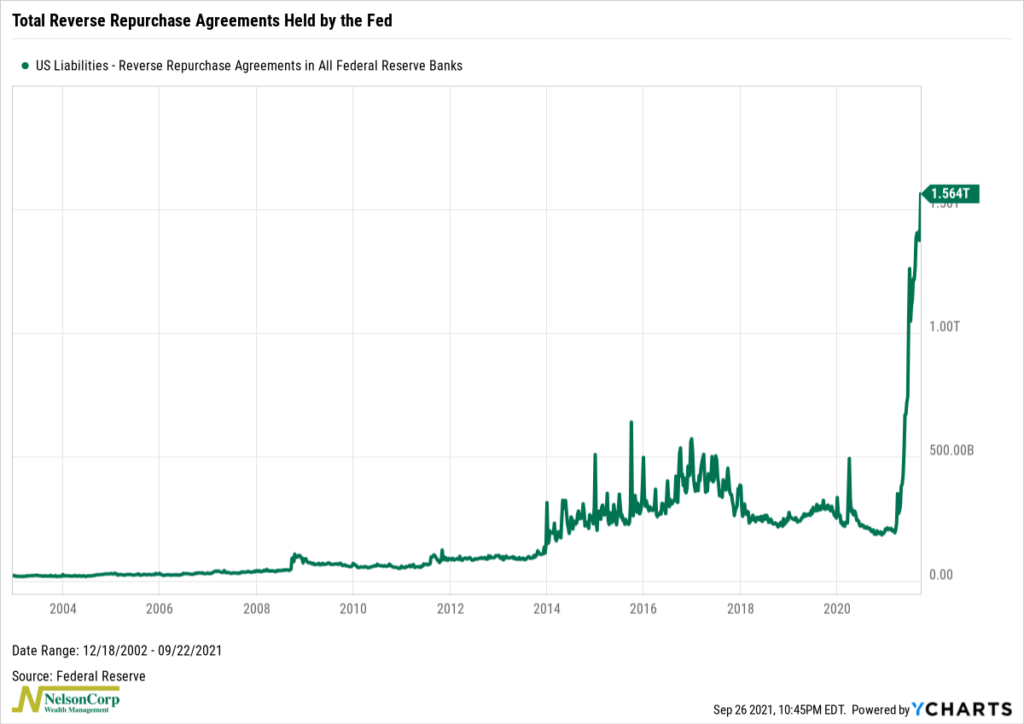
The Fed’s reverse repurchase agreement facility is where institutions like money-market funds can park their excess cash overnight with the central bank. The Fed’s ongoing asset purchases and the Treasury’s drawdown of its cash balance has pushed more liquidity into the system, resulting in a surge in usage of the Fed’s reverse repurchase agreement facility this year.
Sticking with the bucket-filling metaphor, the Fed’s reverse repurchase agreements can be thought of as an overflow tank, or money that will be available to the financial system once the central bank winds down its securities purchases.
It’s all this liquidity or abundantly cheap capital that keeps the stock market bulls excited and eager to put their money to work—despite the negative headlines. And it has also kept our primary stock market risk model moderately bullish, for the time being.
This is intended for informational purposes only and should not be used as the primary basis for an investment decision. Consult an advisor for your personal situation.
Indices mentioned are unmanaged, do not incur fees, and cannot be invested into directly.
Past performance does not guarantee future results.
The post Filling the Buckets first appeared on NelsonCorp.com.