OVERVIEW
U.S. stocks were mixed last week, with the S&P 500 Index gaining 0.06%, the Dow Jones Industrial Average falling 0.12%, and the Nasdaq Composite rising 0.65%.
Growth stocks did well, gaining about 0.88% for the week, whereas value stocks fell around 0.4%.
International stock markets had a decent week. Developed country stocks rose 0.54%, and emerging markets gained 1.85%.
The Treasury yield curve inverted last week as the yield on the 2-year Treasury note rose to 2.47%, and the 10-year note’s yield fell to 2.39%. Long-duration bonds rallied as a result, with long-term Treasuries gaining around 3.46% for the week. Investment-grade corporate bonds rose 1.4%, and high-yield (junk) bonds gained 0.74%.
Real estate had a good week, gaining 4%. Commodities, however, fell around 4.6%. Oil dropped more than 8%, gold fell 1.84%, and corn decreased 2.52%. The U.S. dollar weakened approximately 0.27%.
KEY CONSIDERATIONS
Close, but No Cigar – It was a strong start, followed by a whimper for the U.S. stock market last week.
The S&P 500 stock index was up as much as 1.95% at one point during the week before giving back all its gains and ending the week roughly where it started.
I was watching the price action closely because all the S&P 500 needed to do was gain a mere 0.32% or more for the week to trigger a buy signal from one of our trend indicators that measures percentage reversals.
Based on this indicator, the key index level for the S&P 500 is about 4557, which marks an 8.4% gain from the March 11th low of 4204. This is important because, historically, when the market reverses at least 8.4% from a recent low on a weekly closing basis, it goes on to perform quite well, a sign that a new trend is forming to the upside.
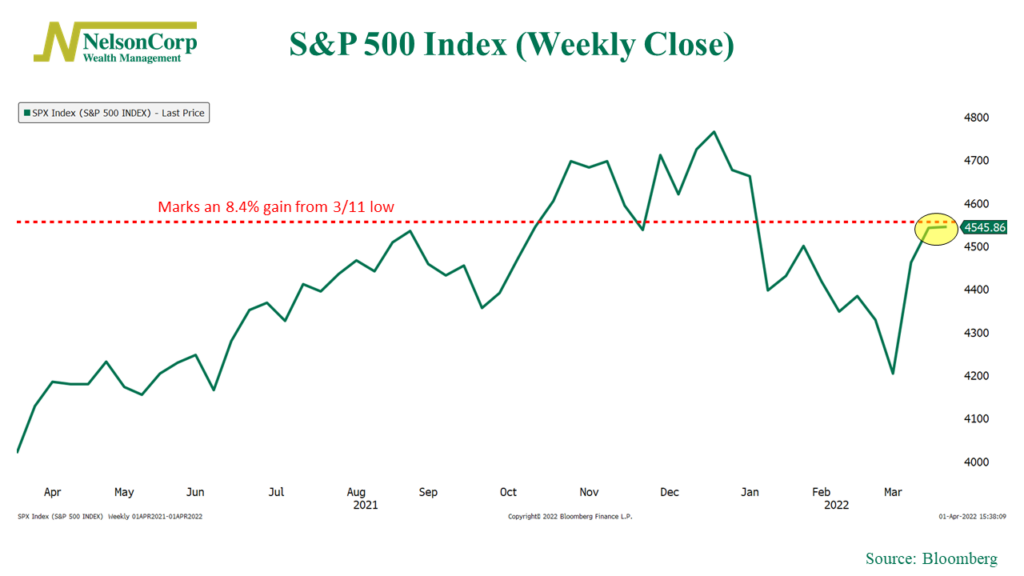
The S&P 500 closed the week at an index level of 4545. That was less than half a percent away from the hurdle rate. Talk about a close call!
So, this week’s price action will likely determine whether this indicator flips positive or not. If it does, the Trend component of our primary stock market risk model will go positive as well (holding all else equal).
This will help the overall model. Over the past few weeks, it has been improving and just needs a few more advancements before it rises into a positive zone.
Or maybe the rally has run its course, and we go on to retest those March lows. That’s possible, too. And one contributing reason for this, among other things, is the fact that the monetary and fiscal environment is no longer helping stocks out.
As you can see on the chart below, the 12-month change in the NDR Real Monetary, Fiscal, and Exchange Rate Policy Index has fallen to a record low level.
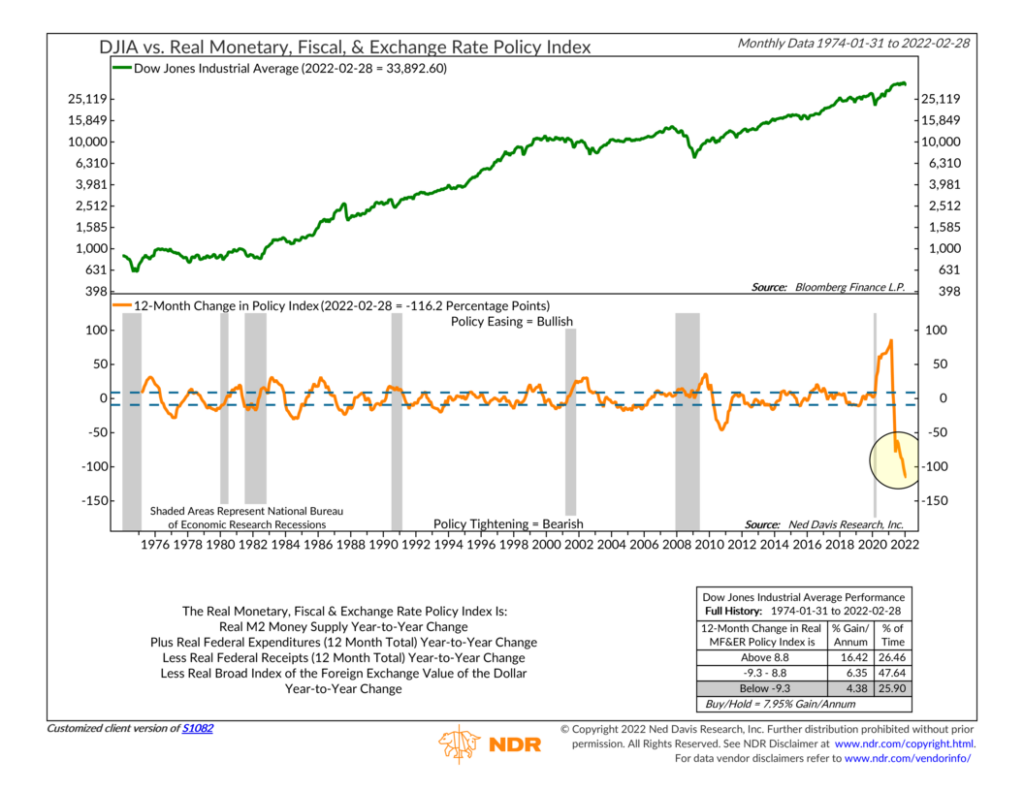
This index measures things like money supply growth, federal government expenditures, and the foreign exchange value of the U.S. dollar. The fact that the 12-month change in this index has fallen off a cliff is one of the big reasons stocks have really struggled so far this year.
So, the main takeaway is that the monetary and fiscal environment is clearly much tougher for the stock market this year. This is undoubtedly a headwind for stock returns. But the market’s price action has been quite strong in recent weeks (barring last week’s whimper), and if it can prove itself in the coming weeks, things could start to look much better for the market environment overall.
This is intended for informational purposes only and should not be used as the primary basis for an investment decision. Consult an advisor for your personal situation.
Indices mentioned are unmanaged, do not incur fees, and cannot be invested into directly.
Past performance does not guarantee future results.
The post Close, but no Cigar first appeared on NelsonCorp.com.