OVERVIEW
The U.S. stock market bounced back after last week’s losses, with the S&P 500 index rising 1.94%, the Dow Jones Industrial Average gaining 0.59%, and the Nasdaq Composite jumping 4.19%.
Small-cap stocks, as represented by the Russell 2000 index, gained about 2.15% for the week. As represented by the Russell 3000 Growth index, growth stocks jumped 3.8%, which outpaced the 0.08% loss in the Russell 3000 Value index.
Foreign stocks ended the week in positive territory. Developed country stocks rose about 1% while emerging market stocks gained around 2.7%.
The U.S. 10-year Treasury note’s yield ended the week around 1.084%, just a tad bit lower than the previous week.
Commodities had a poor week, dropping around 1.3%. Oil prices fell about 0.5%; corn dropped more than 5.5%. Gold, however, rose approximately 1.5%.
And finally, the U.S. dollar continued to weaken, falling about 0.65%.
KEY CONSIDERATIONS
Carrying the Team – The big money is made on the big trends. As old as Wall Street itself, this bit of wisdom echoes from the past and is just as relevant today as it was a century ago.
For this reason, we place a larger weight (50% to be exact) on the price movement of the stock market itself when we model risk. Although there is a madness to the crowd, there is also wisdom. The stock market is a consensus machine that takes everyone’s opinions, estimates, and all the other factors that could influence the financial environment and combines them into a price trend. Most of the time, it makes sense to be on the right side of that trend.
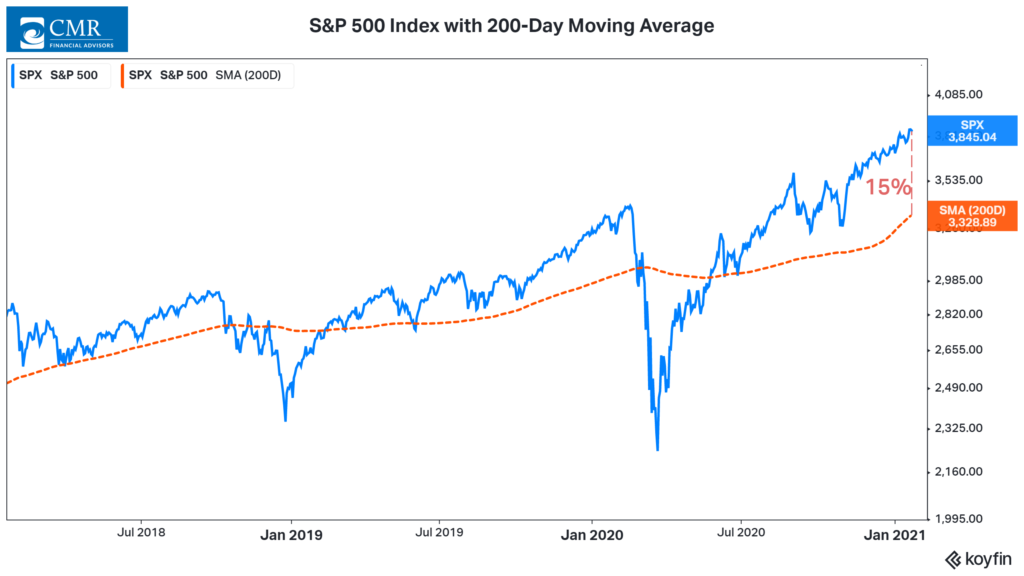
Looking at the S&P 500 stock index, we see that the current price movement is quite strong. The orange dashed line on the chart below represents the average 200-day price of the index over time. Not only has this turned up sharply in recent weeks, but the current level of the index is roughly 15% above the average 200-day price. This is a very bullish trend, to say the least.
Interestingly, though, when we look at the other two areas of risk — investor sentiment and the economic environment — it becomes apparent that the price action is carrying the team on its back, so to speak.
For example, the weight of the evidence has tilted towards the negative side of things for the investor sentiment component. Not only do valuations look stretched, but sentiment based on surveys — like the one produced by the American Association of Individual Investors — is showing signs of excessive optimism (bearish for stocks).
As for the economic environment, this component has moved out of a positive zone and into a neutral zone. This is primarily due to the recent pickup in interest rates and inflation, both of which can have adverse effects on stocks if they rise more than expected.
The indicator in the chart below shows the annual rate-of-change of the Consumer Price Index (a proxy for inflation) relative to its five-year average level. In May of last year, the CPI was about 1.6 percentage points below its five-year average level. That environment of falling inflation, or what we call disinflation, is generally good for stocks.
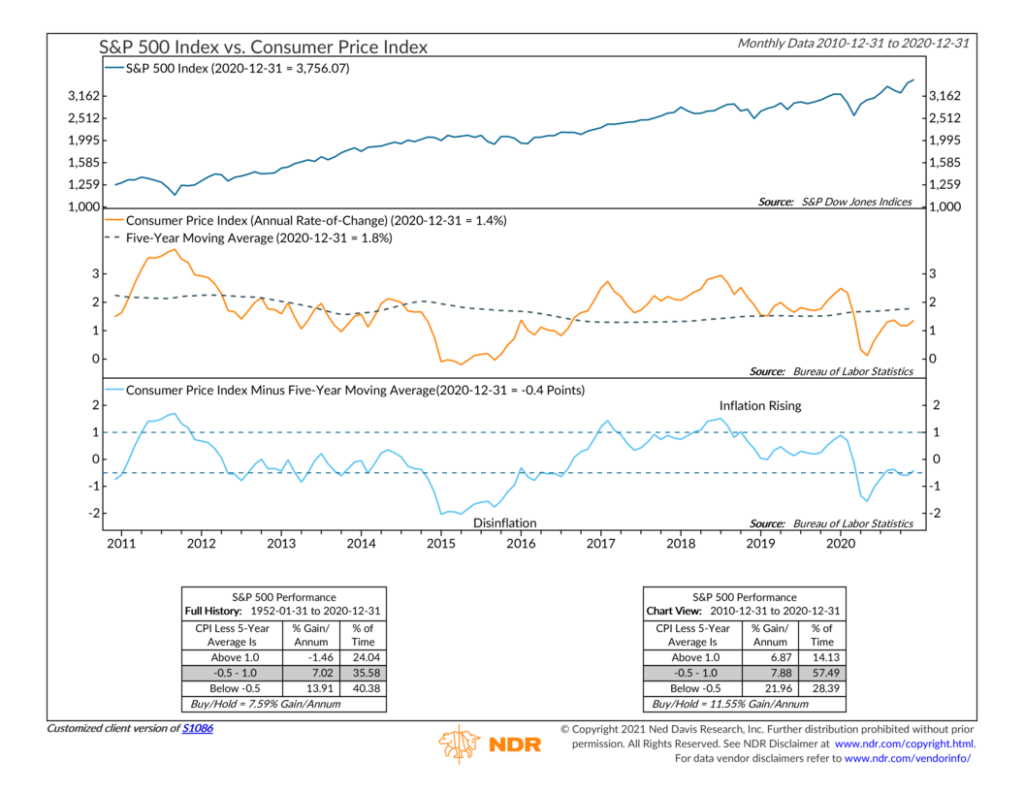
Fast forward to today, however, and the CPI has risen to just 0.4 percentage points below its five-year average level. At this level, the indicator is signaling that inflation has become a neutral, rather than a positive, influence on stock prices. We can generally expect average returns from the S&P 500 stock index in this sort of environment.
The bottom line, then, is that the market’s price action is doing most of the legwork in keeping our risk model in a positive zone. Because of the deterioration in the other two risk areas, the model has become more sensitive to any sudden changes in the stock market’s price action or trend.
This is intended for informational purposes only and should not be used as the primary basis for an investment decision. Consult an advisor for your personal situation.
Indices mentioned are unmanaged, do not incur fees, and cannot be invested into directly.
Past performance does not guarantee future results.
The post Carrying the Team first appeared on NelsonCorp.com.