OVERVIEW
The U.S. stock market slipped last week and ended in negative territory, resulting in the S&P 500 snapping its four-week winning streak. The Dow Jones Industrial Average decreased 0.16%, the Nasdaq Composite declined 2.62%, and the S&P 500 Index shed 1.21%.
Foreign stock markets struggled as well. Developed country stocks fell 2.26%, and emerging market stocks fell 1.51%.
Treasuries have been choppy as of late, but prices fell, and yields rose for the week. The yield on the 2-year Treasury note is now 3.23%, which is higher than the 10-year note’s yield of 2.97% and the 30-year bond’s yield of 3.21%.
Commodities were mostly lower for the week, with the broad index down 0.72%. Crude oil lost ground, falling 1.23%, while gold prices traded lower by 2.9%. Corn prices also fell around 2.96%.
The U.S. dollar resumed its rally last week and is near multi-decade highs. It was up 2.41% last week.
KEY CONSIDERATIONS
A Mixed Bag – Retail took center stage on Wall Street last week as we got economic data about retail spending and second-quarter earnings reports from a handful of big-box retailers.
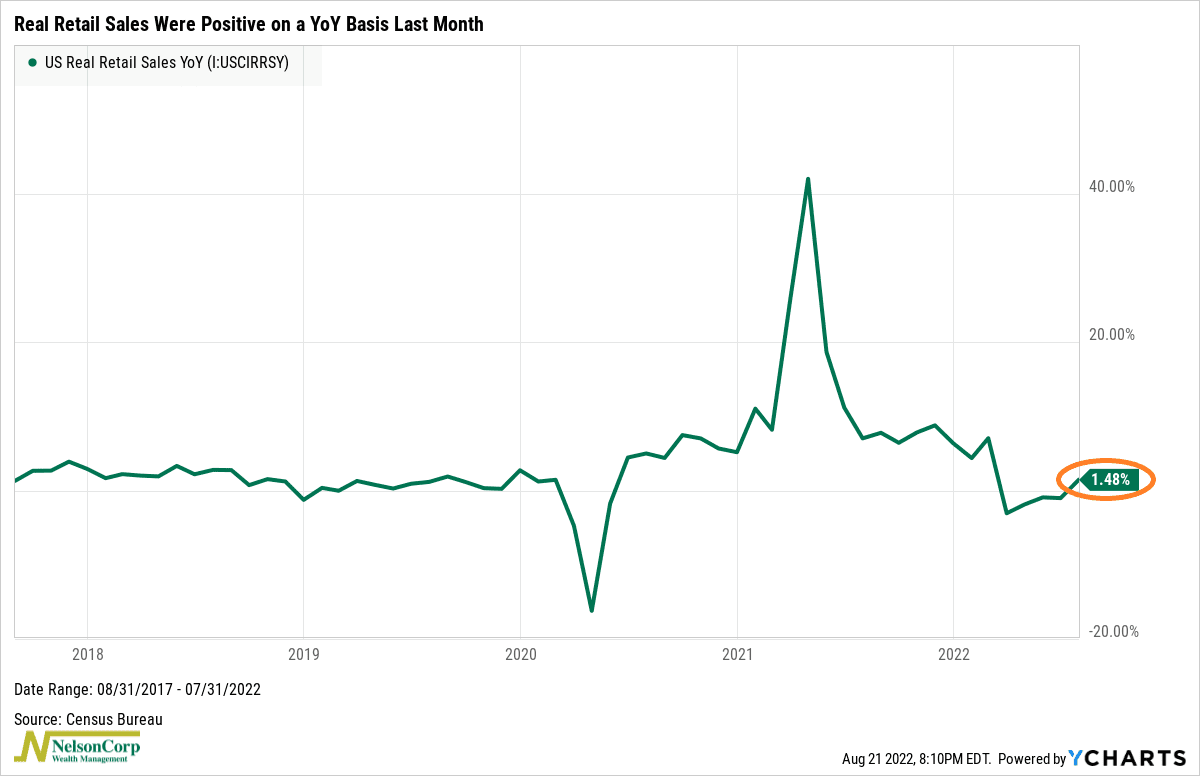
Overall, retail sales—a measure of spending at stores, online, and in restaurants—looked good. While sales were essentially flat in July, this was largely because of cheaper gasoline and fewer purchases of new cars and trucks. Set those categories aside, and sales rose a solid 0.7% in the month.
Compared to a year ago, retail sales were up 10.08%. Of course, inflation is a big reason for that increase. But even if we strip out the effects of inflation—as shown on the chart below—real retail sales were up 1.48% on a yearly basis. This was the first positive reading since February.
So, it appears the American consumer is still spending, despite fears of a recession. But is all that spending showing up on the bottom lines of corporations?
Here the message is mixed. While some retailers reported better-than-expected revenues and profits last quarter, others fell short. There has been a lot of improvement in the inventory build-up issue that plagued retailers at the start of the year. But the side effect is that the markdowns required to clear the shelves of all that excess inventory have put a crimp on profit margins.
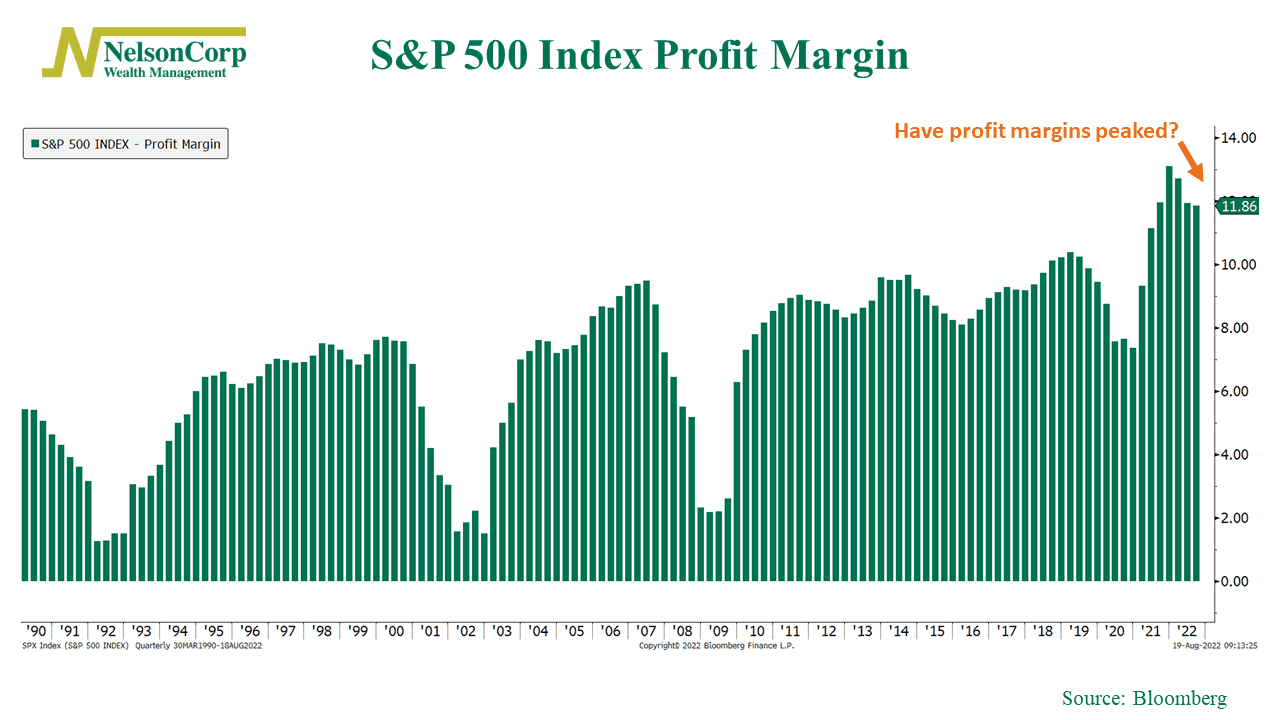
The chart above shows the net profit margin of the companies comprising the S&P 500 index. It peaked at the end of the last year and has been declining all year. When inflation is high like it has been, and companies aren’t able to pass those inflated costs onto consumers, margins take a hit.
Overall, earnings for the second quarter have come in better than feared. This likely explains why stocks have rallied over the past couple of months. But, moving forward, eyes will be on profit margins, inflation, and to what extent companies can pass higher costs through to selling prices.
So that’s the fundamentals. But earnings are just one side of the equation. Valuations—or what investors are willing to pay for those earnings—are also significant.
Which brings us to the Fed, the other prominent actor on the stage last week. Like retail earnings, the message from the minutes from the Fed’s previous meeting was somewhat mixed. Some officials see the Fed staying hawkish for longer, while others see the Fed easing up in the coming months.
According to the most recent reading of the CME FedWatch Tool, the market is placing a fairly equal chance of either a 50 bps or 75 bps rate hike at the next Fed meeting a month from now.
The question, though, is how far will the Fed go in this rate-hike cycle?
That’s the issue the stock market seems to be grappling with at the moment. From a technical perspective, the next big test for the stock market will be whether the S&P 500 Index can surpass its 200-day moving average, as shown in the chart below.
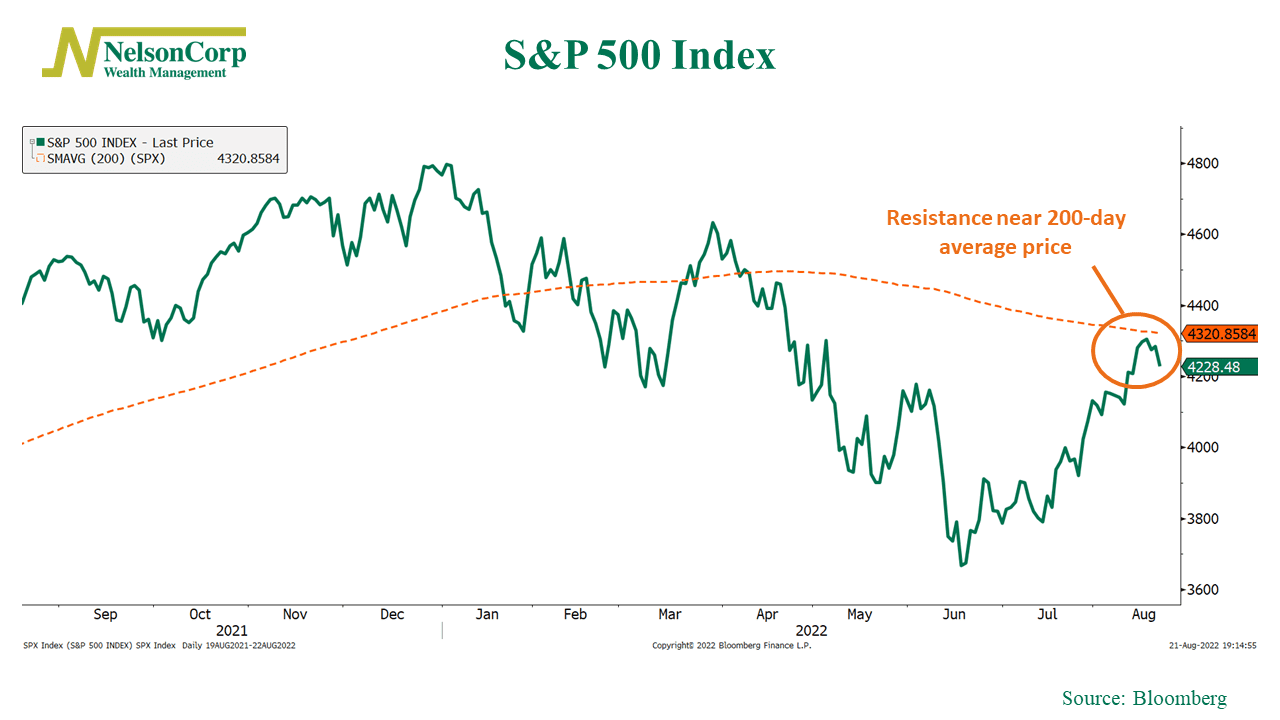
It faltered last week. It cleared the area of congestion that we talked about in prior commentaries, but if it doesn’t break above its average 200-day price, it could run into some trouble.
I’ll end with two more charts that will be important to watch in the coming weeks and months.
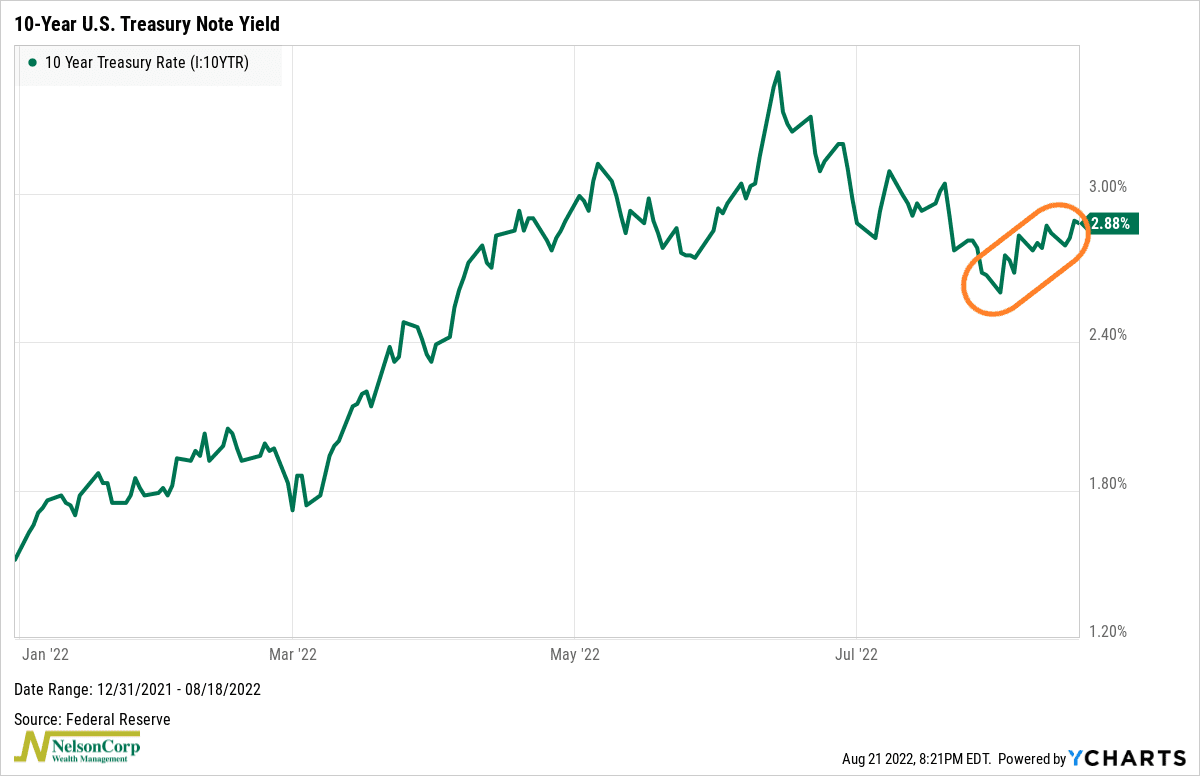
The first is the 10-year Treasury yield, the benchmark for intermediate-term interest rates in the U.S. economy. As the chart below shows, it seems to have reversed course this month and is heading higher. If this continues to increase, it could pressure stock valuations.
The other chart is the U.S. dollar, shown below. Like the 10-year Treasury yield, it has surged this month.
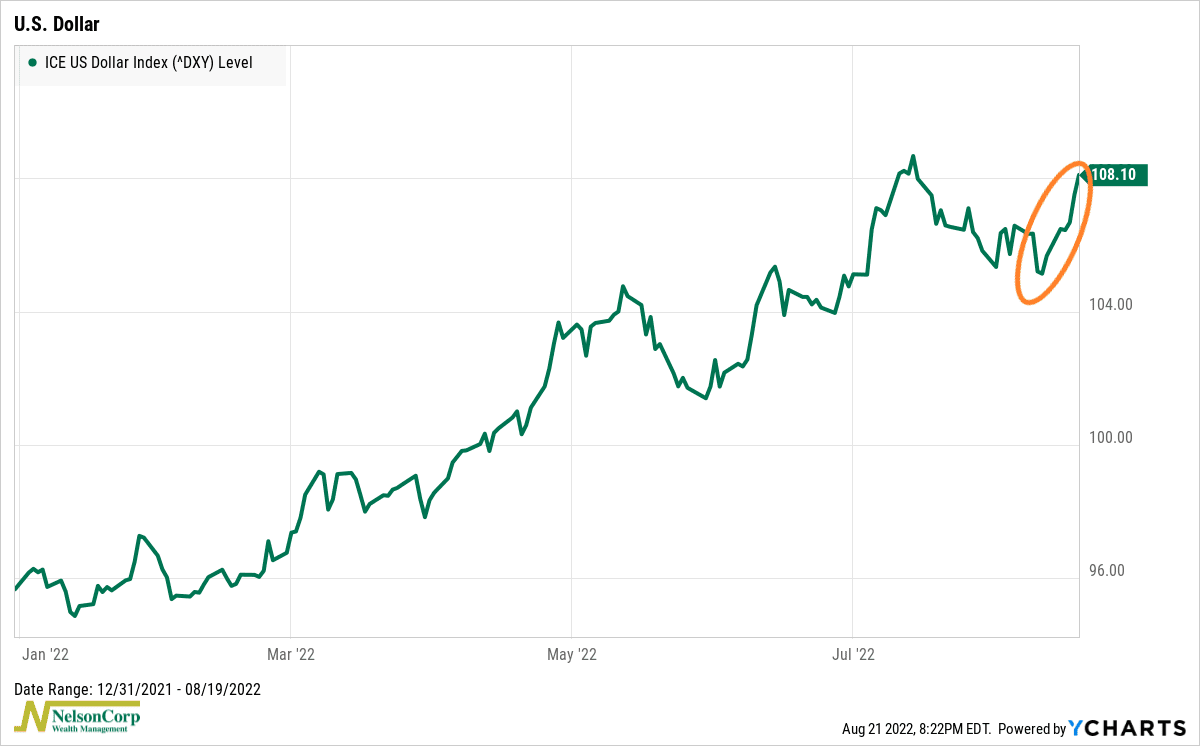
This is significant because among the companies in the S&P 500, something like 40% of their profits come from overseas sales. So, a stronger dollar hurts their profits when those foreign sales get translated back into our currency. It also makes U.S. products less attractive to foreign buyers.
Indeed, on their earnings call, many managers cited the stronger dollar as a reason for lower profits in the second quarter. This could continue to be a factor if we see the dollar strengthen further from here.
So those are two considerable headwinds to watch in the second half of the year. Rising rates and a stronger dollar have equaled a sour recipe for stock returns so far in 2022.
This is intended for informational purposes only and should not be used as the primary basis for an investment decision. Consult an advisor for your personal situation.
Indices mentioned are unmanaged, do not incur fees, and cannot be invested into directly.
Past performance does not guarantee future results.
The post A Mixed Bag first appeared on NelsonCorp.com.