OVERVIEW
U.S. stocks stumbled last week as worrisome inflation and labor market data caught investors by surprise. The Dow fell 1.14%, the S&P 500 dropped 1.39%, and the Nasdaq sank 2.34%.
The Russell 3000 index of growth stocks tumbled 2.16%, whereas their value counterparts fell just 0.75%.
In foreign markets, developed country stocks registered declines of about 1.4%. But emerging markets were the biggest losers for the week, seeing their stocks plummet about 3%.
Interest rates were on the rise again last week. The yield on the U.S. 10-year Treasury note rose to 1.63% from 1.58% the prior week. Long-term Treasuries sold off by about 1.7%. Investment-grade bonds fell 0.47%, high-yield (junk) bonds declined 0.27%, municipal bonds dropped 0.15%, and inflation-protected Treasuries (TIPS) edged lower by about 0.02%.
Real assets didn’t fare much better. Real estate notched losses of roughly 1.4%, and commodities fell broadly by about 1.9%. However, this was primarily due to declines in agricultural commodities like corn, which plunged over 12% for the week. Oil and gold were up 0.63% and 0.45%, respectively.
And finally, the U.S. dollar strengthened by about 0.08% against the world’s major currencies last week.
KEY CONSIDERATIONS
A Little Less Liquid – It certainly isn’t hard to find examples of an economy that is on fire these days. For the first time in what seems like forever, inflation is on the tip of everyone’s tongues. In recent months, commodity prices have surged amid news of numerous shortages and supply chain bottlenecks. And industrial production, while weaker than expected last month, is still up nearly 17% on a year-over-year basis.
Surely this is all good news for the stock market, right?
Not so fast. Liquidity is very important for the financial markets. And what we find is that when economic growth far exceeds the growth rate of liquidity, it means that a rapidly growing economy is siphoning away money from financial assets. This can result in downward pressure on things like stock prices.
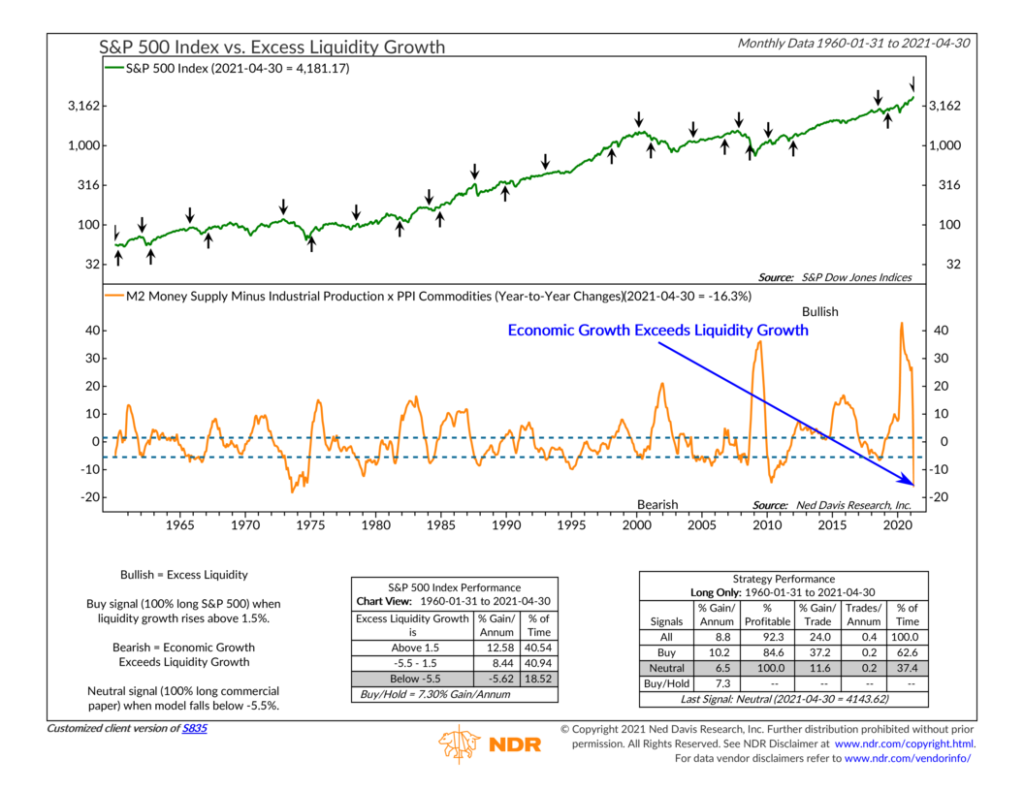
The chart above neatly illustrates this relationship between the monetary and economic environment. It shows the annual growth rate of industrial production and the commodity price component of the Producer Price Index (PPI) subtracted from the 12-month change in the M2 money supply. Industrial production and PPI commodities represent the economy and what is produced with available money. Liquidity is defined as the M2 money supply, a measure of cash that is readily available for spending.
The recent reading from April dropped the indicator to -16.3%, a sign that economic growth is outpacing the growth of liquidity in the financial system. Historically, this has resulted in negative returns for the S&P 500 index of large-cap stocks.
This is definitely something to pay attention to since the story of the past year was the unprecedented amount of liquidity that the Federal Reserve and Congress pumped into the economy and financial markets. Many believe this is the primary reason the downturn and subsequent recovery in stocks was so rapid. Consequently, if the amount of liquidity or money in the system is no longer excessive enough to outpace the real economy, it could mean stocks will face a more challenging road ahead.
As a counterpoint to this analysis, I would point out that while liquidity may be a little less bullish for stocks than before, the stock market’s breadth remains quite strong. The chart below shows that the percentage of U.S. stocks currently trading above their average 200-day price remains over 80%.
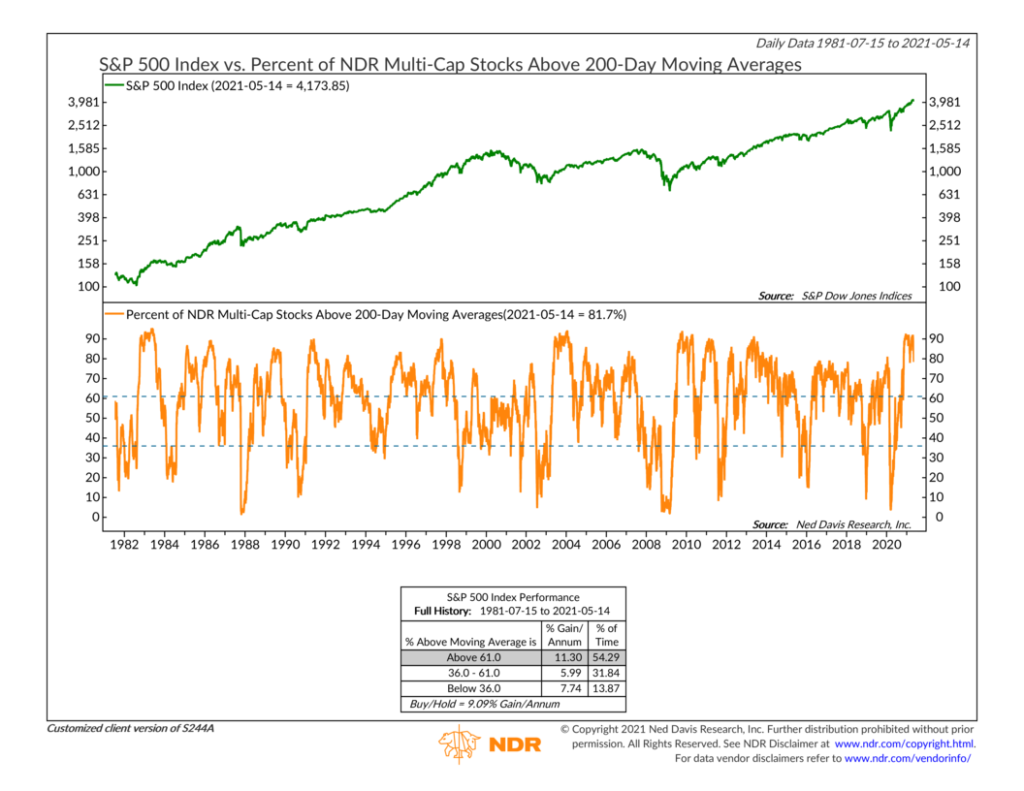
This serves as a reminder that plenty of stocks are participating in the current rally, not just a few highflyers. This continues to bode well for the health of the major stock indexes. To be sure, declining liquidity will be something to watch going forward. But when it comes to managing risk, we also like to respect the trend, so to speak.
This is intended for informational purposes only and should not be used as the primary basis for an investment decision. Consult an advisor for your personal situation.
Indices mentioned are unmanaged, do not incur fees, and cannot be invested into directly.
Past performance does not guarantee future results.
The post A Little Less Liquid first appeared on NelsonCorp.com.