OVERVIEW
U.S. stocks traded lower last week, as the S&P 500 fell 0.37%, the Dow declined 0.36%, and the Nasdaq dropped 1.11%.
The declines were mostly centered around larger capitalization stocks, which fell 0.99%, while small caps rose 1.72%. Value held up well, rising 0.65%, while growth stocks declined 1.19%.
Internationally, we saw developed country stocks rise 0.61% while emerging markets plummeted 2.55%.
Bonds had a good week as the yield on the 10-year U.S. Treasury note fell to 1.23%. Long-term Treasuries rose 0.65%, investment-grade bonds climbed 0.36%, and even high-yield (junk) bonds rose a moderate 0.06%. Municipal bonds fell 0.14%, while inflation-protected Treasuries (TIPS) rose 0.73%.
Real estate, which continues to do really well this year, gained 0.42% on the week. Commodities also climbed about 0.61%. Oil rose 2.41%, gold gained 0.63%, and corn was roughly flat for the week.
The U.S. dollar fell about 0.84% last week but remains up about 2.2% for the year.
KEY CONSIDERATIONS
A Kink in the Hose – Last year, when the pandemic first swept through the country, the Federal Reserve (the Fed) made sure that if the economy was going to go under, it wouldn’t be due to a lack of liquidity (money) in the system.
They didn’t fail in that goal: The year-over-year change in the M2 money supply hit a peak of roughly 27% earlier this year. And not surprisingly, stocks benefited greatly from the massive influx of liquidity.
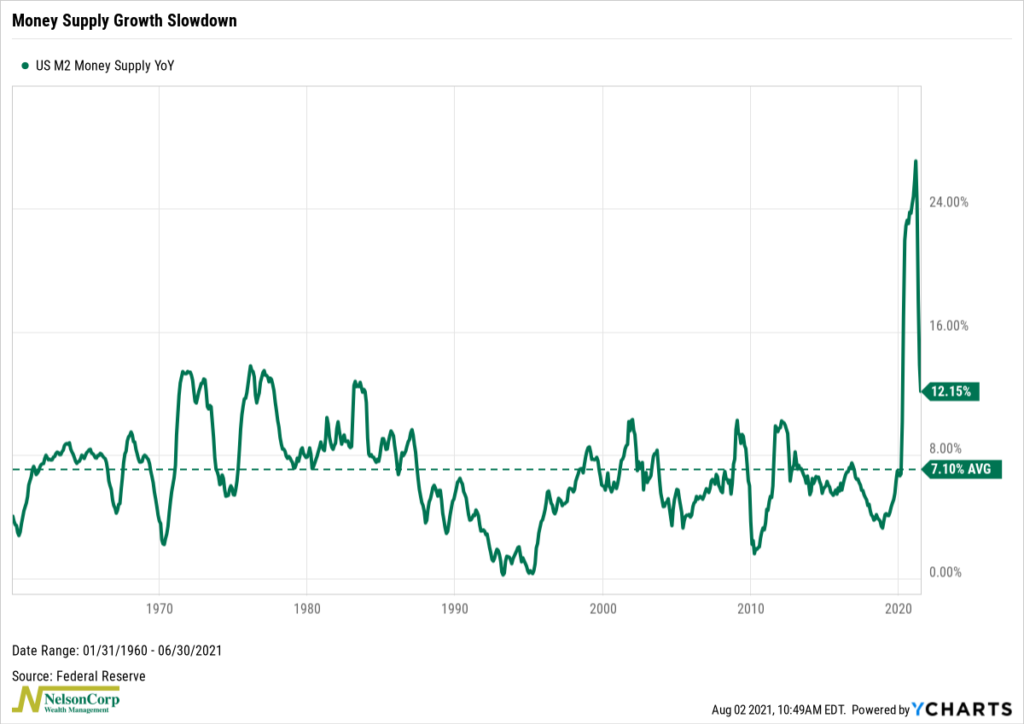
However, looking at the chart above, you’ll notice that the growth rate has come down quite a bit since then. In June, the latest reading, the year-over-year change in the M2 measure of the money supply was around 12%.
To be clear, though, this is still above the historical average of roughly 7%, as shown on the chart. This means that the money supply is still growing, but the rate at which it is growing has come down.
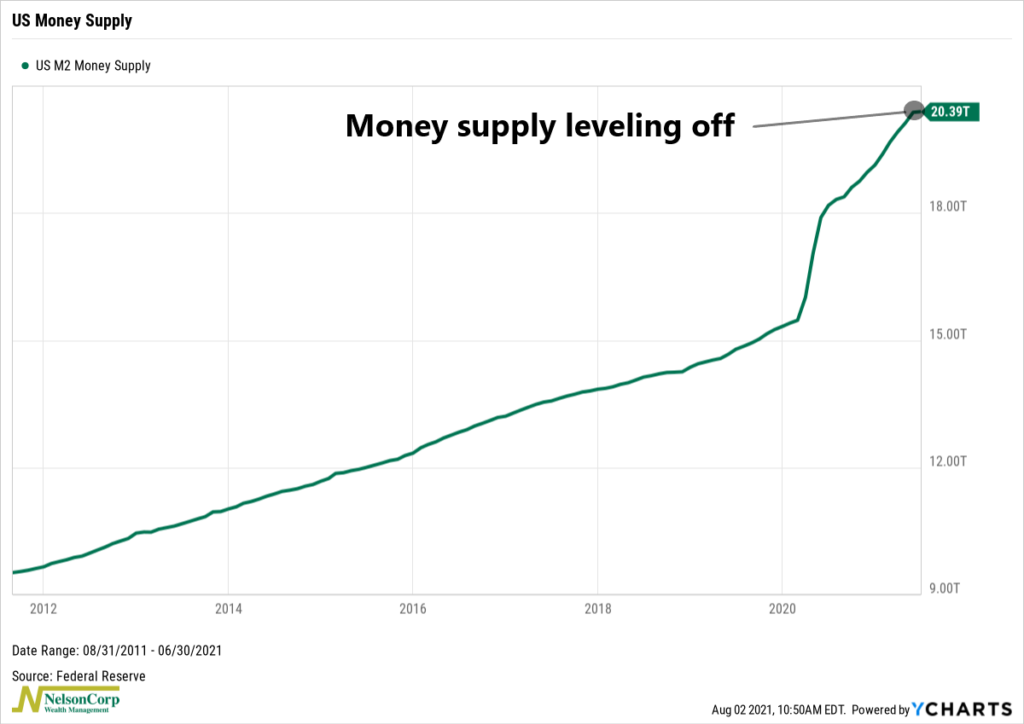
Viewed differently, the chart below shows the actual M2 money supply itself. The dramatic surge in 2020 stands out. But if you squint at the top right of the chart, you can see that the money supply has just barely begun to level off. At roughly $20.4 trillion, this is still a ton of liquidity, but, again, the rate at which it is growing has moderated in recent months.
So, we certainly wouldn’t say monetary policy is “tightening.” Far from it, in fact. Instead, it just means that the exceptionally high rate of money supply growth that we’ve become accustomed to over the past year is becoming less exceptional. You might say that the Fed still has the faucet on but that the hose has a slight kink in it. For investors, that means we should probably expect stocks to appreciate at a rate that is more in line with the long-run historical average.
This is intended for informational purposes only and should not be used as the primary basis for an investment decision. Consult an advisor for your personal situation.
Indices mentioned are unmanaged, do not incur fees, and cannot be invested into directly.
Past performance does not guarantee future results.
The post A Kink in the Hose first appeared on NelsonCorp.com.